


Abstract
To evaluate deformation parameters of an endocardial, mid-myocardial, and epicardial myocardial layer in different transmurality of myocardial infarction and assess whether layer-specific deformation analysis allows definition of infarct transmurality.
Fifty-six patients (mean age 55 ± 9 years, 38 men) with chronic ischaemic left ventricular (LV) dysfunction underwent two-dimensional echocardiography and contrast-enhanced magnetic resonance imaging (ceMRI). The extent of myocardial infarction was determined as relative amount of hyperenhancement by ceMRI in a 16-segment LV model (0%, no infarction; 1–50%, non-transmural infarction; 51–100%, transmural infarction). On the basis of two-dimensional echocardiographic parasternal short-axis views peak systolic circumferential strain was determined for the total wall thickness and for each of three myocardial layers (endocardial, mid-myocardial, and epicardial) using an automatic frame-by-frame tracking system of acoustic echocardiographic markers (EchoPAC, GE Ultrasound). In non-transmural infarction impairment of circumferential strain was greater in the endocardial than the epicardial layer, relative reduction compared with control segments, 45% vs. 28% (P < 0.001), respectively. In transmural infarction additional impairment of circumferential strain was greater in the epicardial than the endocardial layer, relative reduction compared with non-transmural infarction 29% vs. 7% (P < 0.001), respectively. Endocardial layer circumferential strain allowed distinction of non-transmural vs. no infarction with higher accuracy than total wall thickness strain [area under the curve (AUC) 0.842 vs. 0.774, respectively, P = 0.001]. Epicardial layer circumferential strain allowed distinction of transmural from non-transmural infarction with higher accuracy than total wall thickness strain (AUC 0.819 vs. 0.762, respectively, P = 0.005).
Non-transmural infarction results in greater functional impairment of the endocardial than of the epicardial myocardial layer. In transmural infarction both layers are affected similarly compared with controls. A layer-specific analysis of myocardial deformation allows accurate discrimination between different transmurality categories of myocardial infarction.
Introduction
Accurate analysis of myocardial viability is crucial to optimize therapy and definition of prognosis in patients with ischaemic myocardial dysfunction.1–3 Contrast-enhanced magnetic resonance imaging (ceMRI) has become the non-invasive reference technique for assessment of myocardial viability.4–6 Analysis of myocardial deformation using either Doppler-based strain or frame-to-frame tracking of acoustic markers within two-dimensional echocardiographic images has been validated to accurately reflect myocardial deformation and has been proven to allow definition of myocardial viability.7–12 Previously described techniques for analysis of myocardial deformation parameters considered the total myocardial wall thickness. However, the distribution of myocardial infarction is commonly inhomogenous within the total wall thickness.13,14 Non-transmural myocardial infarcts have been described to affect primarily the endocardial layer while the epicardial layers are spared.14 This is in contrast to transmural infarcts that affect all layers of the myocardium. An impairment in myocardial deformation parameters based on the analysis of total wall thickness may reflect a mean of potentially normal deformation of the epicardial myocardial layers and severely impaired deformation of the endocardial layers. There is only little knowledge on the impact of myocardial infarct severity on myocardial function of different myocardial layers. This relates in particular to clinical studies as no imaging method has been available to evaluate a layer-specific parameter of myocardial function.
In this study an evolution of previously validated myocardial speckle-tracking analysis was used which allows separate quantification of myocardial deformation for the endocardial, mid-myocardial, and epicardial myocardial layers. This study sought to define in patients with ischaemic left ventricular (LV) dysfunction,1 whether the impairment in deformation of the endocardial and epicardial myocardial layer is different between various degrees of infarct transmurality, and2 whether a detailed layer-specific analysis of myocardial deformation provides higher accuracy in the distinction between non-infarction, non-transmural, and transmural infarction compared with a deformation analysis considering total wall thickness.
Methods
Patients
Between May 2006 and August 2007, 68 consecutive patients with previous myocardial infarction (18 anterior, 14 lateral, 13 inferior, 11 posterior) and chronic ischaemic LV dysfunction underwent ceMRI for determination of myocardial viability. Patients had to be in sinus rhythm, and myocardial infarction within the last 30 days was an exclusion criteria. Within this population six patients refused participation in the study, five patients had insufficient echocardiographic windows (≥5 segments not visible in an 18-segment model), and one patient had an incomplete ceMRI examination. The remaining 56 patients (mean age 55 ± 9 years, 38 men) formed the study group and underwent ceMRI and two-dimensional echocardiography with myocardial deformation imaging on the same day. Coronary angiography and cineventriculography was performed in all patients within 1 month prior to study inclusion. This study was approved by the local ethics committee and all subjects gave written informed consent.
Echocardiography
Echocardiograms were performed with a Vivid Seven System (GE Vingmed, Horton, Norway) equipped with a 2.5 MHz transducer. LV parasternal short-axis views at basal, midventricular, and apical levels were acquired. Care was taken to obtain circular endoluminal borders of similar size for the three levels by selecting different intercostal spaces. The frame rate for these studies was between 56 and 92 frames/s using tissue harmonic imaging. LV ejection fraction was determined manually by tracing end-systolic and end-diastolic endocardial borders using apical four-chamber and two-chamber views, employing biplane Simpson's method. A 16-segment model with six segments at the basal and midventricular and four segments at the apical short-axis level was used to divide the LV. Wall motion was assessed by visual interpretation for each LV segment as normokinetic, mildly hypokinetic, severely hypokinetic, akinetic, or dyskinetic. Segments defined as severely hypokinetic, akinetic, or dyskinetic were combined as severely dyssynergic in the analysis on transmurality of myocardial necrosis.
Strain and strain rate analysis
The three acquired parasternal short-axis views at basal, midventricular, and apical level were analysed considering the 16-segment model. Analysis was performed off-line with the aid of a novel software package (EchoPAC, GE Vingmed, Horton, Norway). Myocardial markers (acoustic speckles) are identified and followed from frame-to-frame within consecutive two-dimensional echocardiographic images and are expected to change their position in accordance with the surrounding tissue motion. It allows analysis of myocardial deformation parameters for whole LV segments considering the total myocardial wall thickness as described previously.15 In addition to the previously described analysis of myocardial deformation parameters, the system used for this study also allowed analysis of peak systolic circumferential strain and strain rate within three separate myocardial layers of each LV segment—an endocardial, a mid-myocardial, and an epicardial layer. Based on the automatic definition of endocardial and epicardial contours, the three layers were automatically defined by the system by dividing the wall thickness into three layers of similar thickness. In case of disagreement of the observer with automatically defined borders, manual correction could be applied. Systolic circumferential strain and strain rate considering the total wall thickness as well as of each myocardial layer were automatically calculated using a medium degree of spatial and temporal smoothing. They are parameters related to deformation along the curvature of the LV in the parasternal short axis. In this analysis only segments with optimal tracking quality were included. The system automatically determines tracking quality on a scale ranging from 1.0 for optimal to 3.0 for unacceptable for each analysed segment.15 Segments with suboptimal tracking quality (grading >2.0 by the system) were dismissed from the analysis. The tracking quality of the remaining segments was controlled visually to ensure adequate automatic tracking. End-systole was defined as aortic valve closure in the apical axis view and transferred to all other views.
To define intraobserver and interobserver variability in the determination of myocardial deformation parameters, the same observer and a second independent observer repeated the analysis of the first 15 consecutive patients (27% or the total cohort) 4 weeks apart using the same two-dimensional echocardiographic loop and the same cardiac cycle. The Lin coefficient16 was calculated as an aggregate measure for agreement with a maximum range between −1 and +1. It represents for continuous data an analogue of the weighted kappa coefficient determined for ordinal data. For intraobserver agreement, the Lin coefficient was 0.98 (95% CI 0.97–0.99) for total wall thickness circumferential strain and 0.93 (95% CI 0.88–1.00) for circumferential strain rate. For interobserver agreement of the total wall thickness, the Lin coefficient was 0.96 (95% CI 0.94–0.98) for circumferential strain and 0.90 (95% CI 0.86–0.97) for circumferential strain rate. Layer-specific analysis of the intraobserver agreement demonstrated a Lin coefficient of 0.97 (95% CI 0.96–0.98) for the endocardial layer circumferential strain and of 0.98 (95% CI 0.97–0.99) for the epicardial layer circumferential strain. Layer-specific analysis of the interobserver agreement demonstrated a Lin coefficient of 0.96 (95% CI 0.94–0.98) for the endocardial layer circumferential strain and of 0.95 (95% CI 0.93–0.97) for the epicardial layer circumferential strain.
Contrast-enhanced cardiac magnetic resonance imaging
All patients underwent ceMRI on a 1.5 T whole-body MR scanner (Intera, Best, Philips, the Netherlands) using a five-element phased-array cardiac coil with the patient placed supine. After 15 min of intravenous injection of 0.2 mmol/kg body weight Gd-DTPA (Magnevist, Schering, Berlin, Germany), 8 mm short-axis slices were acquired with a prospective electrocardiogram (ECG)-gated gradient echo sequence with inversion prepulse. Images were transferred to a workstation equipped with a dedicated cardiac software package (MassSoftware, Medis, Leiden, the Netherlands) for further analysis as described before.17 The same 16-segment LV model as used for the echocardiographic analysis was applied. To obtain alignment of echocardiographic and ceMRI segments, anatomical landmarks such as the papillary muscles and orientation of the LV outflow tract as well as end-diastolic cavum diameters were used. Each myocardial segment was evaluated for the presence of hyperenhancement, defined as an area of signal enhancement ≥3 SD of the signal intensity of non-enhanced myocardium. The total myocardial area and the contrast-enhanced area of each segment were traced manually. The segmental extent of hyperenhancement was calculated, defined as the percentage contrast-enhanced area of the total myocardial area (Areahyperenhancement/Areamyocardium × 100). A 0% hyperenhancement was considered to reflect non-infarction; 1–50% hyperenhancement was considered to reflect non-transmural infarction while 51–100% hyperenhancement was considered to reflect transmural infarction.
Statistics
Continuous data are expressed as mean ± SD, categorical data as frequencies. A reasonable assumption is that the observations within a patient are correlated, therefore a repeated measures analysis of variance (rmANOVA) with an exponential spatial covariance structure was applied to compare mean deformation values between segments with hyperenhancement: 0% (normal), <1–50% (non-transmural), and <51–100% (transmural). In addition, a test for linear trend was performed because of the ordinal nature of the analysed effect. To address the issue of clustered data (data on multiple segments per patient used in the analysis), a generalized estimating equation approach18 with a binomial distribution, a logit link, and a working correlation matrix with exchangeable correlation assumption was used to explore the ability of strain parameters to differentiate between the infarction groups. In the first analysis we tried to distinguish segments with no infarction from segments with either non-transmural or transmural infarction; in a second analysis segments with transmural infarction were compared with all other segments.
The output from this analysis allowed the derivation of receiver-operating characteristic (ROC) curves, which were used to designate cut-off values. In order to achieve a better comparability of the methods, we decided to keep the specificity fixed so that it does not fall below 70% and maximize the sensitivity over the set of eligible cut-off values. Once the optimal cut-off values were determined using 1000 bootstrap samples from the original data with sample size equal to the study presented here, we performed a second bootstrap to calculate 95% bootstrap confidence intervals for sensitivity and specificity in order to compensate for the uncertainty concerning the true parameters. The sample size was pre-chosen for at least 55 patients, as this size has been shown in other studies on this topic to be adequate for reasonable analysis.11,12 All tests were two-sided and assessed at the 5% significance level. All statistical analyses were performed using SAS Release 9.13 (SAS Institute Inc., Cary, NC, USA) except for ROC curves for which we used MedCalc for Windows, version 9.3.2.0 (MedCalc Software, Mariakerke, Belgium).
Results
Clinical baseline characteristics of all patients are given in Table 1. Significant coronary artery stenosis (>50% diameter stenosis) was documented in each patient. Image quality allowed the analysis of circumferential strain and strain rate in 797 segments (89%). Of these segments, 486 segments (61%) demonstrated normal function or minor hypokinesis by echocardiography and 311 segments (39%) demonstrated severe dyssynergy.
Clinical baseline characteristics
| Patients (n = 56) | |
|---|---|
| Age (years) | 55 ± 9 |
| Gender (males) | 38 |
| Heart rate (b.p.m.) | 71 ± 8 |
| Weight (kg) | 89 ± 10 |
| Height (m) | 1.69 ± 0.3 |
| Diabetes mellitus (n) | 16 (29%) |
| Hypertension (SBP/DBP >140/90 mmHg) (n) | 35 (62%) |
| Smoking (n) | 21 (38%) |
| Hypercholesterolaemia (cholesterol >5 mmol/L) (n) | 30 (54%) |
| Family history (n) | 23 (41%) |
| Ejection fraction (%) | 44 ± 8 |
| One-vessel disease (n) | 36 (64%) |
| Two-vessel disease (n) | 15 (27%) |
| Three-vessel disease (n) | 5 (9%) |
| Concomitant therapy | |
| ACE/ARB (n) | 25 (44%) |
| β-receptor blockers (n) | 48 (85%) |
| Calcium-channel blockers (n) | 10 (18%) |
ACE, angiotensin-converting enzyme-inhibitors; ARB, angiotensin II receptor blockers; SBP, systolic blood pressure; DBP, diastolic blood pressure.
Cardiac magnetic resonance imaging
In 797 segments adequate tracking of acoustic markers within all segmental layers was obtained. Among the 311 dyssynergic segments there were 21 segments defined as non-infarcted, 155 segments as non-transmural infarcts (1–50%), and 135 segments as transmural infarcts (51–100%). Segments with late enhancement indicating infarction were distributed as follows: apical, 113 segments; midventricular, 101 segments; and basal, 76 segments. Total LV mass defined by MRI was 146 ± 35 g and total infarct size 27 ± 20 g (18.5 ± 13.5%).
Myocardial deformation related to hyperenhancement
Strain and strain rate measurements related to hyperenhancement by ceMRI are given in Table 2 for the total myocardial wall thickness as well as for each of the three myocardial layers. There was a continuous decline in circumferential strain and strain rate from inner to mid-myocardial and outer layer irrespective of infarct transmurality defined by ceMRI.
Circumferential strain and strain rate for the total wall thickness and for each of three myocardial layers related to the relative degree of myocardial hyperenhancement by contrast-enhanced magnetic resonance imaging
| No infarct (0% LE) | Non-transmural infarct (1–50% LE) | Transmural infarct (51–100% LE) | P (overall effect) | P (linear trend) | |
|---|---|---|---|---|---|
| Total wall thickness deformation | |||||
| SC (%) | −23.3 ± 7.2 | −16.9 ± 7.2 | −13.3 ± 6.7 | <0.0001 | <0.0001 |
| SCR (1/s) | −2.2 ± 0.7 | −1.6 ± 0.8 | 1.5 ± 1.4 | <0.0001 | <0.0001 |
| Layer-specific deformation | |||||
| SC endocardial layer (%) | −30.2 ± 12.2 | −16.7 ± 5.1 | −15.5 ± 8.4 | <0.0001 | <0.0001 |
| SC mid-myocardial (%) | −22.3 ± 10.2 | −15.3 ± 6.9 | −12.0 ± 7.9 | <0.0001 | <0.0001 |
| SC epicardial layer (%) | −17.3 ± 8.2 | −12.5 ± 4.9 | −8.9 ± 4.9 | <0.0001 | <0.0001 |
| SCR endocardial layer (1/s) | −2.6 ± 0.6 | −2.0 ± 0.7 | −1.5 ± 1.1 | <0.0001 | <0.0001 |
| SCR mid-myocardial (1/s) | −2.4 ± 0.6 | −1.8 ± 0.8 | −1.3 ± 1.0 | <0.0001 | <0.0001 |
| SCR epicardial layer (1/s) | −1.8 ± 0.7 | −1.2 ± 0.8 | −0.9 ± 1.0 | <0.0001 | <0.0001 |
LE, hyperenhancement; SC, circumferential strain; SCR, circumferential strain rate.
Circumferential strain and strain rate decreased with increasing transmurality of myocardial infarction. This decline was observed for total wall thickness deformation as well as each of the three myocardial layers. In non-transmural infarction impairment of circumferential endocardial layer strain was greater than impairment of epicardial layer strain, relative reduction 45% vs. 28% (P < 0.001), respectively, compared with control segment. In transmural infarction additional impairment of circumferential strain was greater in the epicardial layer than in the endocardial layer, relative reduction 29% vs. 7% (P < 0.001), respectively, compared to segments with non-transmural infarction. Figures 1 and 2 demonstrate ceMRI and circumferential strain images and curves of a patient with non-transmural infarction showing pronounced reduction of strain in the endocardial layer of the infarcted segments. Figures 3 and 4 demonstrate ceMRI and circumferential strain images and curves of a patient with transmural infarction showing reduced strain in all myocardial layers of the infarcted segments.
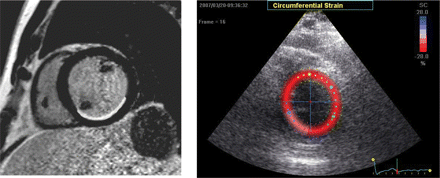
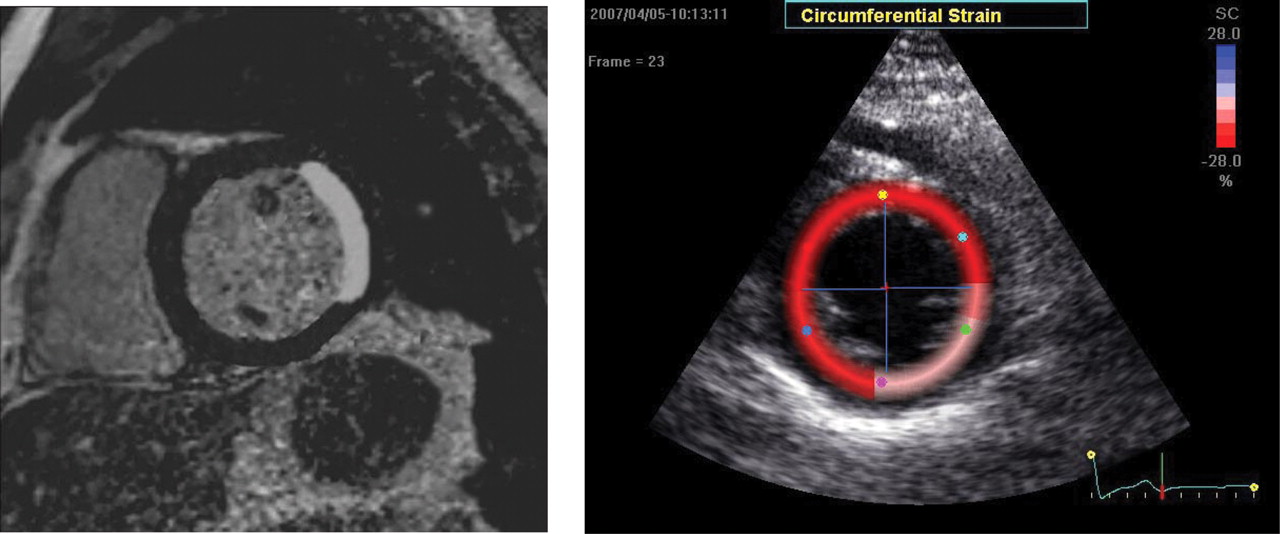
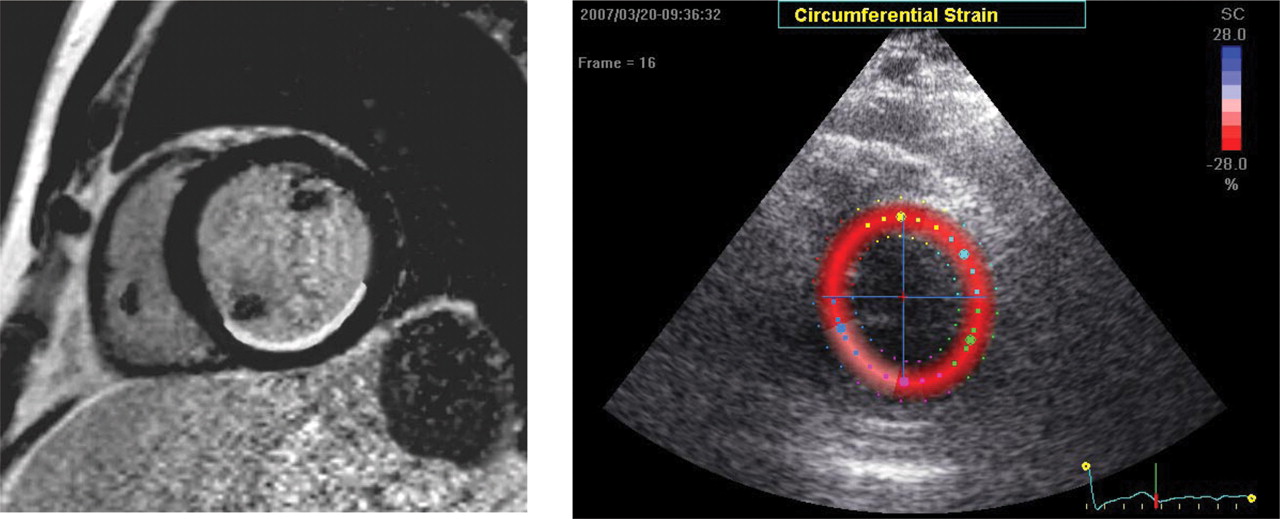
Contrast-enhanced magnetic resonance image (ceMRI; left panel) and colour-coded short-axis circumferential strain images at end-systole (right panel) in a patient with severe hypokinesia and non-transmural infarction of the posterior and inferior wall by ceMRI (<50% hyperenhancement of the total wall).
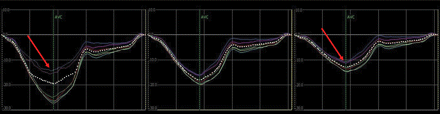
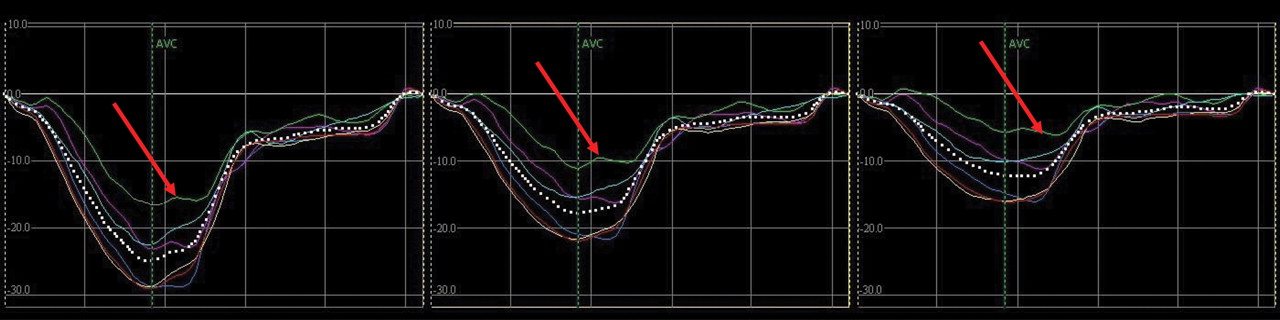
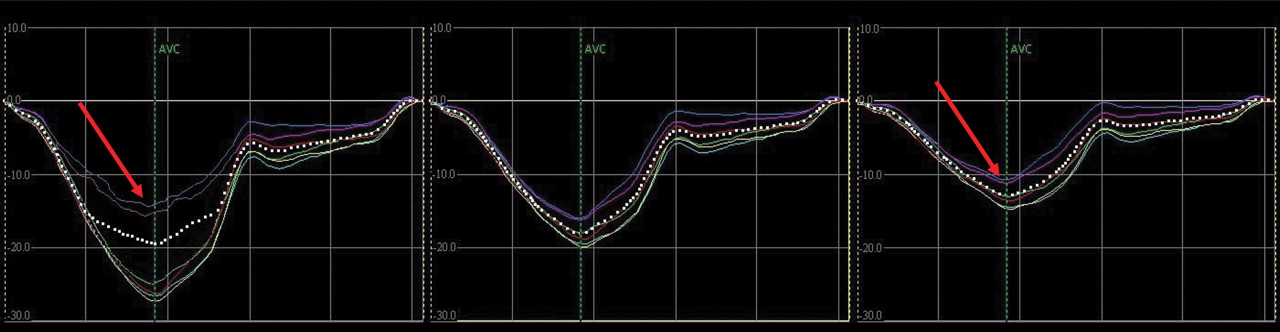
Circumferential strain tracings of the same patient for each of the six segments as indicated in Figure 1 (same colours). Tracings on the left reflect the endocardial layers, in the middle the mid-myocardial layers, and on the right the epicardial layers of the six segments. The circumferential strain tracings of the endocardial layers of the posterior and inferior segments demonstrate pronounced reduction, while there is only minor reduction in the epicardial layer of these segments (both indicated by arrows).
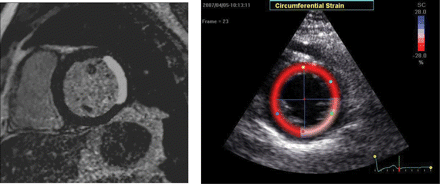
Contrast-enhanced magnetic resonance image (ceMRI; left panel) and colour-coded short-axis circumferential strain images at end-systole (right panel) in a patient with akinesia and transmural infarction of the lateral wall by ceMRI (>50% hyperenhancement of the total wall).
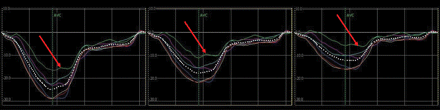
Circumferential strain tracings of the same patient for each of the six segments as indicated in Figure 3. Tracings on the left reflect the endocardial layers, in the middle the mid-myocardial layers, and on the right the epicardial layers. The tracings of all layers of the lateral segments demonstrate reduced peak systolic circumferential strain values (indicated by arrows).
Endocardial to epicardial layer deformation ratio
A ratio of endocardial to epicardial layer circumferential strain and strain rate was calculated and related to hyperenhancement by ceMRI. The endocardial to epicardial layer circumferential strain ratio was significantly different between non-infarcted segments, segments with non-transmural infarction, and segments with transmural infarction (2.0 ± 0.4, 1.6 ± 0.3, and 1.9 ± 0.5, respectively, P < 0.001). The different endocardial to epicardial strain ratio can be explained by a greater impairment of the endocardial layer circumferential strain in non-transmural infarction and similar impairment of endocardial and epicardial layer circumferential strain in transmural infarction (Table 2).
The endocardial to epicardial layer strain rate ratio also demonstrated lowest values for segments with non-transmural infarction reflecting greater impairment of endocardial than epicardial circumferential strain rate. It was 2.0 ± 0.4, 1.8 ± 0.6, and 2.1 ± 0.5 for segments without infarction, segments with non-transmural infarction, and segments with transmural infarction, respectively.
Consequently, the relationship of endocardial layer strain to total wall thickness strain was different in non-transmural infarcts compared with non-infarcted segments and transmural infarcts as shown in Figure 5.
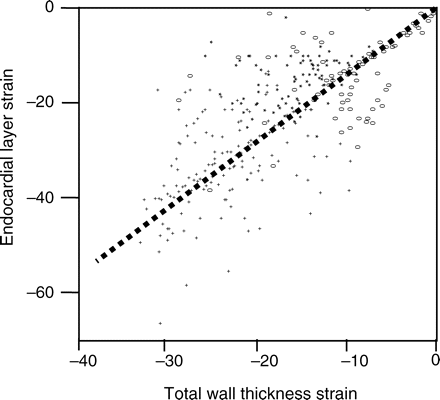
Association of endocardial layer strain to total wall thickness strain in segments without infarction (plus symbols), segments with non-transmural infarction (asterisks), and segments with transmural infarction (elongated open circles) as defined by contrast-enhanced magnetic resonance imaging. The dashed line indicates correlation for all segments irrespective of infarct transmurality. The relationship of endocardial layer to total wall thickness strain is non-linear. In non-transmural infarction segments there is greater impairment of endocardial layer strain than impairment of total wall thickness strain.
Distinction of non-transmural infarction vs. no infarction
Considering hyperenhancement findings by ceMRI segments with non-transmural infarction could be distinguished from segments without infarction using total wall thickness circumferential strain and strain rate or layer-specific circumferential strain or strain rate analysis (Table 3). Endocardial layer circumferential strain had a higher sensitivity than total wall thickness circumferential strain to detect non-transmural infarction (86% vs. 68%, respectively, P < 0.001). There was no difference in specificity. The epicardial layer circumferential strain analysis did not provide higher sensitivity or specificity than total wall thickness analysis for distinction of non-transmural infarction vs. no infarction. Performing ROC analysis for the detection of non-transmural infarction vs. non-infarction, the area under curve (AUC) was 0.774 (95% CI 0.740–0.806), considering the total wall thickness circumferential strain. Considering endocardial layer-specific circumferential strain for detection of non-transmural infarction, the AUC was significantly larger (0.842, 95% CI 0.811–0.869; P < 0.001) indicating greater accuracy in the distinction of non-transmural infarction vs. non-infarction (Figure 6, left panel). The AUC was not significantly larger for epicardial layer-specific circumferential strain analysis in the detection of non-transmural infarction vs. non-infarction.
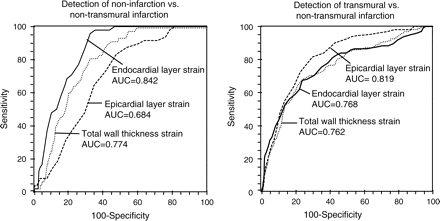
Receiver-operating characteristic curves, including the area under curve of total wall thickness strain, endocardial, and epicardial layer circumferential strain for detection of non-infarction vs. non-transmural myocardial infarction (left panel) and transmural vs. non-transmural myocardial infarction (right panel) defined by contrast-enhanced magnetic resonance imaging.
Accuracy of total wall thickness and layer-specific deformation parameters for detection of non-infarction (0% hyperenhancement, n = 21 segments) vs. non-transmural infarction (1–50% hyperenhancement by contrast-enhanced magnetic resonance imaging, n = 155 segments)
| CS (total segment) | CS rate (total segment) | CS (endocardial) | CS rate (endocardial) | CS (epicardial) | CS rate (epicardial) | |
|---|---|---|---|---|---|---|
| Sensitivity (%) | 67.3 | 70.6 | 85.7 | 78.4 | 67.9 | 76.5 |
| 95% Bootstrap CI | 64.5–83.4 | 68.9–84.5 | 77.8–95.3 | 75.2–88.3 | 58.3–71.4 | 65.6–86.3 |
| Bootstrap SE | 7.22 | 6.41 | 8.03 | 5.92 | 8.67 | 5.44 |
| Specificity (%) | 71.8 | 73.1 | 70.0 | 71.2 | 70.4 | 71.4 |
| 95% Bootstrap CI | 70.4–73.9 | 72.2–78.7 | 70.0–74.4 | 70.4–81.6 | 69.5–77.8 | 70.4–78.9 |
| Bootstrap SE | 1.14 | 2.01 | 1.34 | 2.22 | 2.56 | 2.34 |
| Cut-off value | −16.3 | −1.9 | −23.0 | −2.3 | −13.0 | −1.6 |
| 95% Bootstrap CI | −15.3 to −17.3 | −1.7 to −2.0 | −21.1 to −24.2 | −2.1 to −2.4 | −11.9 to −13.2 | −1.4 to −1.6 |
| Bootstrap SE | 0.53 | 0.07 | 0.69 | 0.07 | 0.52 | 0.05 |
| AUC | 0.774 | 0.721 | 0.842 | 0.774 | 0.684 | 0.766 |
| 95% CI | 0.740–0.806 | 0.687–0.753 | 0.811–0.869 | 0.742–0.804 | 0.646–0.720 | 0.734–0.796 |
AUC, area under the curve; CS, circumferential strain; CI, confidence interval; SE, standard error.
Separate ROC analyses for the basal, midventricular, and apical level were performed to define whether there are differences in the distinction between non-infarction and non-transmural infarction. The cut-off values to distinguish between non-infarction vs. non-transmural infarction were not significantly different between the three baso-apical levels.
Distinction of non-transmural vs. transmural infarction
Segments with transmural infarction could be distinguished from segments with non-transmural infarction considering1 total wall thickness peak circumferential strain and strain rate,2 layer-specific peak circumferential strain and strain rate (Table 4). Endocardial layer strain and strain rate did not offer an advantage in the distinction of non-transmural vs. transmural infarction compared with total wall thickness strain and strain rate analysis. However, epicardial layer circumferential strain had a higher sensitivity than total wall thickness strain analysis to detect transmural infarction (83% vs. 71%, respectively, P = 0.0347).
Accuracy of total wall thickness and layer-specific deformation parameters for detection of non-transmural infarction (1–50% hyperenhancement, n = 155 segments) vs. transmural myocardial infarction (>50% hyperenhancement by contrast-enhanced magnetic resonance imaging, n = 135 segments)
| CS (total segment) | CS rate (total segment) | CS (endocardial) | CS rate (endocardial) | CS (epicardial) | CS rate (epicardial) | |
|---|---|---|---|---|---|---|
| Sensitivity (%) | 71.0 | 62.6 | 70.4 | 72.1 | 83.0 | 72.6 |
| 95% Bootstrap CI | 66.5–74.4 | 59.4–68.2 | 68.11–77.6 | 69.5–85.7 | 77.4–92.2 | 65.5–78.8 |
| Bootstrap SE | 8.02 | 7.25 | 5.23 | 8.35 | 7.31 | 7.21 |
| Specificity (%) | 73.5 | 72.5 | 73.5 | 72.5 | 71.3 | 70.6 |
| 95% Bootstrap CI | 71.4–81.6 | 70.5–83.9 | 70.1–83.7 | 69.9–83.5 | 70.3–76.7 | 70.2–81.2 |
| Bootstrap SE | 2.25 | 3.84 | 3.92 | 3.87 | 4.71 | 3.04 |
| Cut-off value | −13.6 | −1.6 | −21.4 | −2.2 | −11.3 | −1.3 |
| 95% Bootstrap CI | −11.3 to −14.3 | −1.1 to −1.6 | −20.0 to −24.1 | −1.9 to −2.5 | −9.1 to −12.2 | −0.5 to −1.0 |
| Bootstrap SE | 1.01 | 0.12 | 0.71 | 0.11 | 0.79 | 0.16 |
| AUC | 0.762 | 0.674 | 0.768 | 0.758 | 0.819 | 0.782 |
| 95% CI | 0.731–0.791 | 0.643–0.705 | 0.737–0.797 | 0.698–0.762 | 0.792–0.846 | 0.775–0.828 |
AUC, area under the curve; CS, circumferential strain; CI, confidence interval; SE, standard error.
Performing an ROC analysis for detection of transmural infarction vs. non-transmural infarction, the AUC was 0.762 (95% CI 0.731–0.791) considering total wall thickness circumferential strain. Considering epicardial layer-specific circumferential strain for detection of transmural infarction, the AUC was significantly larger (0.819, 95% CI 0.792–0.846, P < 0.001), indicating greater accuracy (Figure 6, right panel). The AUC was not significantly larger for endocardial layer-specific circumferential strain analysis in the detection of transmural infarction.
Receiver-operating characteristic curve analyses were repeated individually for the three levels. The cut-off values to distinguish between non-transmural infarction vs. transmural infarction were not significantly different between the baso-apical levels.
Discussion
This study demonstrates that (i) non-transmural infarction results in greater functional impairment of the endocardial myocardial layer than that of the epicardial myocardial layer; (ii) in transmural infarction both layers are affected similarly compared with controls; (iii) accuracy of a layer-specific analysis of myocardial deformation in the differentiation between different transmurality categories of myocardial infarction is higher than an analysis considering the total wall thickness as one layer; (iv) analysis of the endocardial myocardial layer allows improved accuracy in the differentiation between non-infarction and non-transmural infarction; (v) analysis of the epicardial layer allows improved differentiation between non-transmural and transmural infarction.
Extent of myocardial infarction
Myocardial infarction models as well reperfusion studies of myocardial infarction have indicated that endocardial tissue layers are first affected by ischaemia and infarction. Similarly, they are the last to benefit from reperfusion while cellular and functional integrity of epicardial tissue layers are preserved longer and may also recover to a greater extent. In the dog reperfusion model, the epicardial layer is usually spared from infarction by early reperfusion.19 In another dog reperfusion study, function recovered to normal values in the epicardial infarcted reperfused myocardium while the endocardial wall of the infarcted area demonstrated tissue loss and loss of function.20 The progression of myocardial necrosis from endocardial to epicardial tissue layers has been described as the wavefront of myocardial infarction.14
Because of the variable affliction of different myocardial tissue layers by ischaemia and infarction, any method which analyses the extent of myocardial infarction considering the complete myocardial wall thickness will be less accurate than the methods allowing specific assessment of different myocardial layers.
Determination of myocardial viability
Myocardial deformation imaging considering a myocardial velocity gradient as well as Doppler strain technique have been described in experimental studies to allow differentiation of non-transmural from transmural infarcts.9,10 More recently speckle tracking echocardiography has been shown to allow accurate definition of myocardial deformation.7,8,21,22 Both Doppler as well as speckle tracking-based myocardial deformation analysis have been found in clinical studies to allow definition of myocardial viability.11,12,23–25 However, the differentiation of transmural from non-transmural infarction has not been optimal using strain analysis of total wall thickness with a reported sensitivity of 71.2% and a specificity of 70.1%12 and only limited accuracy (AUC in an ROC analysis = 0.71).12,24
Deformation imaging technique in the current study
This study used a refined technique of myocardial deformation measurement based on previously validated methods. It allowed analysis of myocardial deformation for three layers of similar thickness—an endocardial, a mid-myocardial, and an epicardial tissue layer. Strain values for the three myocardial layers in normal contracting segments without hyperenhancement demonstrated a significant gradient with greatest myocardial deformation in the endocardial layer and less deformation in the mid-myocardial or even epicardial layers. This gradient reflects known differences in function between endocardial and epicardial layers as demonstrated by experimental sonomicrometry measurements.26 With increasing extent of hyperenhancement, deformation parameters decreased for all three myocardial layers. However, the decrease of peak systolic strain with increasing extent of hyperenhancement was not simultaneous for the three myocardial layers. Non-transmural infarction affected deformation as a parameter of function more in the endocardial layer than in the epicardial layer. Thus, deformation analysis of the endocardial myocardial layer allowed distinction of non-transmural infarction from non-infarction with high accuracy. The epicardial layer was less accurate in this respect. In contrast, distinction of transmural from non-transmural infarction could be performed better by analysis of the epicardial myocardial layer. Deformation of the endocardial layer is depressed in transmural as well as non-transmural infarcts, while deformation of the epicardial layer is impaired in transmural infarction and less impaired in non-transmural infarcts. Both, distinction of transmural from non-transmural infarction as well as distinction of non-transmural infarction from non-infarction could be performed with higher accuracy using layer-specific analysis compared with an analysis including the total segment thickness.
Limitations
There is no published experimental study which has validated the layer-specific analysis of myocardial deformation parameters. However, the analysis package is derived from a well validated system for analysis of total wall thickness deformation parameters.7,8,21,22 The high spatial resolution of the system allowed separation of the total wall thickness into three separate layers. Thus, similar accuracy on the layer-specific analysis level can be assumed as for the previously evaluated total wall thickness accuracy. Similar accuracy for the layer-specific analysis as for the previously evaluated total wall thickness analysis was defined in a recent technical validation study using Field II phantoms.27 In addition, the current study may be considered as a good clinical proof of the new method.
Myocardial deformation parameters for analysis of myocardial viability could not be determined in 11% of segments. A finding related to the inherent limitations of most echocardiographic techniques to display all LV segments with high image quality and the decision to reject all measurements of myocardial deformation parameters in case of an insufficient tracking quality. While the system provides strain results of three layers within a segment, it should be recognized that deformation parameters within the three layers are not independent. Because of constancy of mass and volume, any deformation of the epicardial layer resulting in circumferential shortening of that segment will result in a deformation of the endocardial layer even if the endocardial layer is completely non-functional. This passive deformation results in persistent deformation of the endocardial layer even in case of non-transmural infarction affecting the complete endocardial layer. Thus, myocardial deformation of each layer is the result of active function within the layer and passive motion from adjacent tissue. Still, myocardial deformation analysis has been proven to be useful before for the analysis of myocardial function characteristics.28 There was the possibility of misalignment in segmental data obtained by ceMRI and myocardial deformation imaging as in all studies comparing different imaging modalities. By definition of landmarks used for both modalities, this issue was kept to a limited level. Analysis of myocardial hyperenhancement by ceMRI sequence is prone to artefacts associated with patients movement or inadequate breath-holding, which can be interpreted as areas of hyperenhancement by mistake. In this study a cut-off value of 50% related to hyperenhancement by ceMRI was used to distinguish between non-transmural and transmural infarction. This classification relates to previously used classifications.9 Other classifications using higher cut-off values have also been used previously.11 Finally, it should be noted that circumferential strain values may also be impaired because of very tight coronary stenosis (>90%) inducing acute myocardial ischaemia.29 This may impair specificity in the distinction between different degrees of infarct transmurality.
Conclusions
Non-transmural infarction results in greater impairment in myocardial deformation of the endocardial than the epicardial myocardial layer. In transmural infarction deformation of the endocardial and epicardial myocardial layers is impaired similarly. A layer-specific analysis of myocardial deformation allows accurate discrimination between different transmurality categories of myocardial infarction and appears to be superior to total wall thickness myocardial deformation analysis.
Funding
The German–Israeli Foundation for Scientific Research & Development (GIF, I-873-77.10/2005).
Conflict of interest: none declared.

