


Abstract
In the setting of percutaneous coronary intervention (PCI), due to a paucity of data, the optimal dose of aspirin is uncertain. We evaluated the safety of different doses of aspirin after PCI.
In the PCI-CURE study, 2658 patients with acute coronary syndromes undergoing PCI were stratified into three aspirin dose groups ≥200 mg (high, n = 1064), 101–199 mg (moderate, n = 538), and ≤100 mg (low, n = 1056). For efficacy, the moderate- (7.4%) and high-dose groups (8.6%) had similar rates of cardiovascular death, myocardial infarction, or stroke compared with the low-dose group (7.1%). For safety, major bleeding was increased with high-dose aspirin [3.9, 1.5, and 1.9% in the high-, moderate-, and low-dose groups; hazard ratio (HR) of high vs. low dose 2.05 (95% CI 1.20–3.50, P = 0.009]. The net adverse clinical events (death, MI, stroke, major bleeding) favoured low-over high-dose aspirin (8.4 vs. 11.0%, HR 1.31, 95% CI 1.00–1.73 P = 0.056).
In this large observational analysis of patients undergoing PCI, low-dose aspirin appeared to be as effective as higher doses in preventing ischaemic events but was also associated with a lower rate of major bleeding and an improved net efficacy to safety balance.
Introduction
Randomized trials of patients with acute coronary syndromes (ACS) have shown that aspirin, in doses ranging from 75 to 1300 mg daily, reduces mortality.1–4 Observational studies of patients with vascular disease not undergoing percutaneous coronary intervention (PCI) suggest that higher doses are associated with similar efficacy for prevention of ischaemic events but an increased risk of major bleeding.5–8 However, in the setting of PCI, there are few data comparing the efficacy and safety of low- vs. high-dose aspirin.
Most trials evaluating anti-platelet therapy following PCI with stent used aspirin doses of ≥200 mg routinely.9–12 Consequently, there is little data from randomized trials demonstrating the efficacy and safety of low-dose aspirin after stent implantation. The American Heart Association and American College of Cardiology PCI guidelines recommend an aspirin dose of 162–325 mg after PCI with stent.13 In contrast, the European Society of Cardiology PCI guidelines recommend low-dose (≤100 mg) aspirin after PCI with stent.14 This disparity in expert committee recommendations for aspirin dose after PCI with stent highlights the paucity of data relating to optimal aspirin dose.
The objective of this analysis from the Clopidogrel in Unstable angina to prevent Recurrent Events (CURE) study is to compare the relative efficacy and safety of ≤100 mg (low dose) vs. 101–199 mg (moderate dose) vs. ≥200 mg (high dose) of aspirin after PCI.
Methods
Patients
The CURE study was a randomized, double-blind trial that compared clopidogrel with placebo on a background of aspirin in 12 562 patients with ACS without ST-segment elevation.15 PCI-CURE was a substudy of the CURE trial and included more detailed data collection on the subset of patients in the CURE trial that underwent PCI (n = 2658). The design of the CURE and PCI-CURE studies has been previously published.15–17 Briefly, for CURE, patients were eligible for inclusion if patients had symptoms compatible with ACS within the preceding 24 h and did not have ST-elevation of >1 mm and had either (i) elevated cardiac enzymes (more than twice the upper limit of normal) or (ii) electrocardiographic evidence of ischaemia. Patients were excluded if they had contraindications to antithrombotic therapy or antiplatelet therapy, if they were at high risk of bleeding, if they had New York Heart Association Class IV heart failure, if they required long-term anticoagulation, if they had undergone PCI or coronary artery bypass surgery in the preceding 3 months, or if they had received a glycoprotein IIb/IIIa inhibitor less than 3 days prior to randomization. Patients were treated with either placebo or clopidogrel, in addition to aspirin, for up to 1 year (mean 9 months) after randomization and the subgroup of patients who had PCI was included in PCI-CURE. Data were collected on case report forms and follow-up obtained at study visits as described in the CURE design paper.16
Aspirin dose
Aspirin was given in doses of 75–325 mg daily in addition to study drug at the discretion of the treating physician. The dose and compliance with aspirin therapy was recorded on the case report forms and at each visit for the duration of the trial. The patients were divided into aspirin dose groups based on the dose of aspirin used during initial hospitalization. The analysis by aspirin dose was not pre-specified in the protocol for PCI patients.
Outcomes
The efficacy outcomes examined in this analysis were the composite of cardiovascular (CV) death, myocardial infarction (MI), and stroke at 30 days and at follow-up (mean follow-up 8 months). Deaths were considered CV unless an obvious non-cardiac cause was identified. MI was defined as at least two of the three following criteria: ischaemic symptoms, elevation of cardiac markers (creatine kinase, creatine kinase MB isoenzyme or troponin) to at least twice the upper limit of normal or three times the upper limit of normal within 48 h of PCI (if previously elevated, then a rise of 20%), or new electrocardiographic changes consistent with myocardial ischaemia.15,16 Biomarkers of myocardial necrosis were measured if there was a clinical need.
The safety outcome was major bleeding at 30 days and long-term follow-up (mean follow-up 8 months) after PCI. Major bleeding was defined as bleeding that was significantly disabling, intraocular bleeding leading to significant loss of vision, or bleeding requiring transfusion of 2 units of red blood cells or equivalent whole blood, a drop in hemoglobin concentration of 5 g/L, bleeding causing significant hypotension requiring intravenous inotropes or surgical intervention, symptomatic intracranial hemorrhage or bleeding that was fatal.
Finally, the net adverse clinical events were evaluated with the composite of death, MI, stroke, or major bleeding at 30 days and long-term follow-up.
Analyses
Patients undergoing PCI were stratified into three aspirin dose groups: ≥200 mg (high), 101–199 mg (moderate), and ≤100 mg (low). The aspirin dose groups were chosen based on previous literature of bleeding rates and aspirin, in addition to current PCI guidelines.5,7,13,14 Event rates after index PCI were calculated using the Kaplan–Meier method and long-term event rates were reported at 1 year. For efficacy outcomes, a Cox proportional hazards model was used to estimate the hazard ratio (HR) and 95% confidence intervals with and without co-variate adjustment for known risk factors for ischaemic events in ACS18 and included age, gender, weight, hypertension, prior documented coronary stenosis, TIMI risk score components, study drug (clopidogrel), positive biomarker status at randomization, ST-deviation prior to randomization, stent use, and geographic region.
For major bleeding and net clinical adverse events, a Cox proportional hazard model was performed to build two models for co-variate adjustment. Co-variates were chosen based on previous known association with bleeding from the literature.15,19,20 The first model included age, gender, weight, glycoproteins IIb/IIIa use, TIMI risk score components, study drug (clopidogrel), non-steroidal anti-inflammatory drugs, heparin use, oral anticoagulant use, stent use, and coronary artery bypass surgery. The second model used the variables in the first model in addition to geographic region to specifically examine the confounding effect of geographic region. Adjustment for geographic region takes into account the potential differences in practice patterns across regions, including length of stay in hospital and use of revascularization procedures. The categories of geographic region used for adjustment were (i) North America and Latin America, (ii) Eastern Europe, and (iii) Western Europe, South Africa, and Australia. All outcomes are presented with and without adjustment and all statistical tests were two-sided and the level of significance used was 0.05. No adjustment for multiple testing was performed. The software used for the analysis was SAS version 8.2.
Finally, the aspirin dose groups were further divided into study drug group (clopidogrel) vs. placebo group and outcomes were compared across dose groups. Interaction P-values were reported for tests of homogeneity for the treatment effect of clopidogrel across three aspirin dose groups. Interaction P-values were also reported for test of homogeneity of treatment effect of different aspirin doses between clopidogrel and placebo groups. This may be important as patients on long-term clopidogrel may have increased risk of bleeding and the aspirin dose may be particularly important in this group. All patients undergoing PCI with a stent were to receive a minimum of 2–4 weeks of open-label thienopyridine therapy.
Results
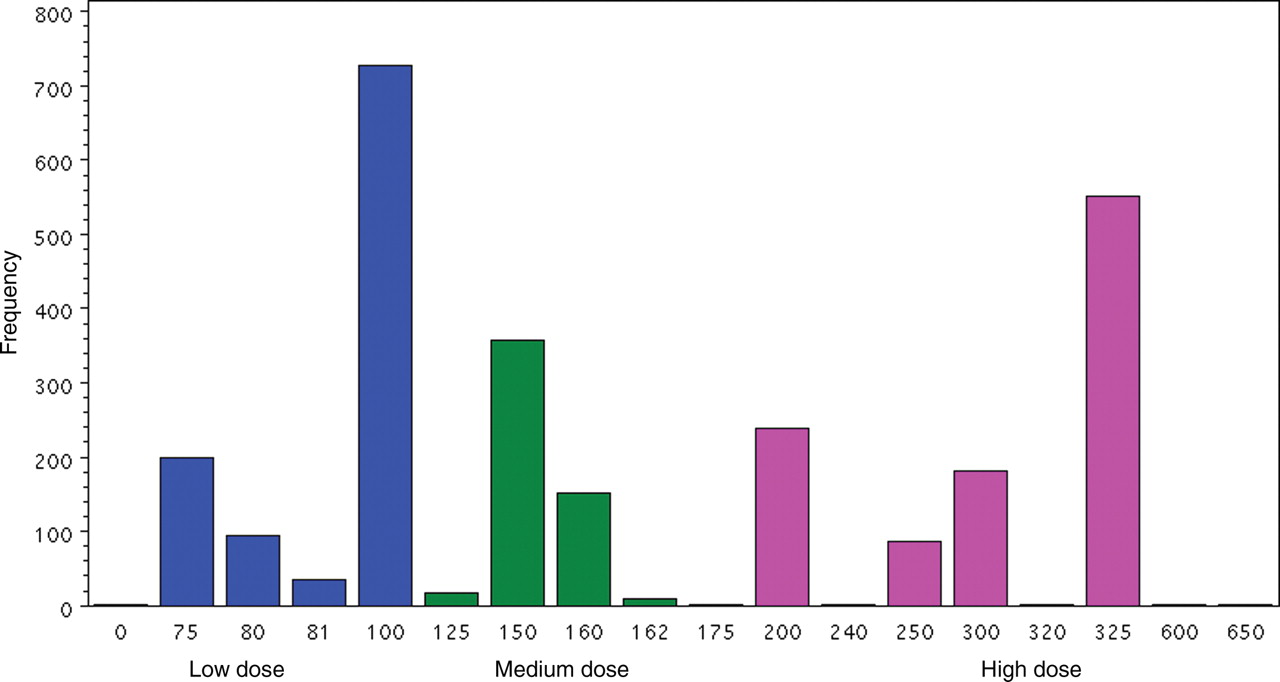
There were 1056 patients who received low dose (≤100 mg), 538 patients who received moderate dose (101–199 mg), and 1064 patients who received high dose (≥200 mg) aspirin. The median aspirin doses for low, medium and high groups were 100, 150, and 325 mg, and a histogram of actual doses is shown in Figure 1. The baseline characteristics of the patients in the three aspirin dose groups are presented in Table 1. There was a significant regional variation in aspirin dose with low-dose aspirin primarily used in Europe and high-dose aspirin primarily used in North America. Table 1 also outlines other therapies used and shows that the high-dose aspirin group had a significantly higher rate of concurrent glycoproteins IIb/IIIa inhibitor and heparin use. The rates of coronary stenting in low-, medium-, and high-dose groups were 78, 79, and 87%, respectively.
Histogram of aspirin dose in low-, medium-, and high-dose groups.
Regional distribution and baseline characteristics by aspirin dose group
| Low dose (≤100 mg, n = 1056) | Medium dose (101 to 199 mg, n = 538) | High dose (≥200 mg, n = 1064) | |
|---|---|---|---|
| Regional distribution | |||
| Canada/USA | 51 (9.0) | 13 (2.3) | 505 (88.8) |
| Latin America, n (%) | 30 (10.8) | 27 (9.7) | 221 (79.5) |
| Australia/New Zealand/South Africa, n (%) | 41 (19.2) | 138 (64.5) | 35 (16.4) |
| Western Europe, n (%) | 781 (60.2) | 231 (17.8) | 286 (22.0) |
| Eastern Europe, n (%) | 153 (51.2) | 129 (43.1) | 17 (5.7) |
| Mean age | 62.2 (10.9) | 61.0 (10.6) | 61.1 (11.3) |
| Weight (kg), mean (SD) | 79.4 (14.4) | 78.0 (14.0) | 79.1 (15.7) |
| Male (%) | 741 (70.2) | 382 (71.0) | 731 (68.7) |
| Prior aspirin use (%) | 662 (62.7) | 304 (56.5) | 733 (68.9) |
| Current smokers (%) | 301 (28.5) | 161 (29.9) | 340 (32.0) |
| Previous MI (%) | 281 (26.6) | 153 (28.4) | 274 (25.8) |
| Diabetes (%) | 182 (17.2) | 98 (18.2) | 224 (21.1) |
| Hypertension (%) | 541 (51.2) | 271 (50.4) | 583 (54.8) |
| Prior documented coronary stenosis (%) | 290 (27.5) | 128 | |
| History of PCI (%) | 141 (13.4) | 57 (10.6) | 163 (15.3) |
| History of CABG (%) | 130 (12.3) | 50 (9.3) | 152 (14.3) |
| ST depression (%) | 449 (42.5) | 143 (39.8) | 373 (35.1) |
| Elevated cardiac enzymes (%) | 252 (23.9) | 143 (26.6) | 382 (35.9) |
| TIMI risk score, mean (SD) | 3.2 (1.3) | 3.1 (1.2) | 3.4 (1.3) |
| Medications during follow-up | |||
| Heparin (%) | 1012 (95.8) | 517 (96.1) | 1047 (98.4) |
| NSAIDs (%) | 127 (12.0) | 62 (11.5) | 121 (11.4) |
| GP IIb/IIIa inhibitors (%) | 262 (24.8) | 102 (19.0) | 362 (34.0) |
| Oral anticoagulants (%) | 45 (4.3) | 19 (3.5) | 43 (4.0) |
Aspirin dose
The aspirin dose groups were based on aspirin dose used in hospital after randomization. In the low-dose group, at both 30 days and long-term follow-up, 86% were still taking low-dose aspirin. In the moderate-dose aspirin group, at 30 days and long-term follow-up, 78 and 73% were still taking moderate-dose aspirin. In the high-dose aspirin group, at 30 days and long-term follow-up, 82 and 73% were still taking high-dose aspirin. The highest cross-over was from the moderate- and high-dose aspirin groups to low-dose aspirin which was 13 and 10% at 30 days and 21 and 17% at long-term follow-up, respectively.
Efficacy
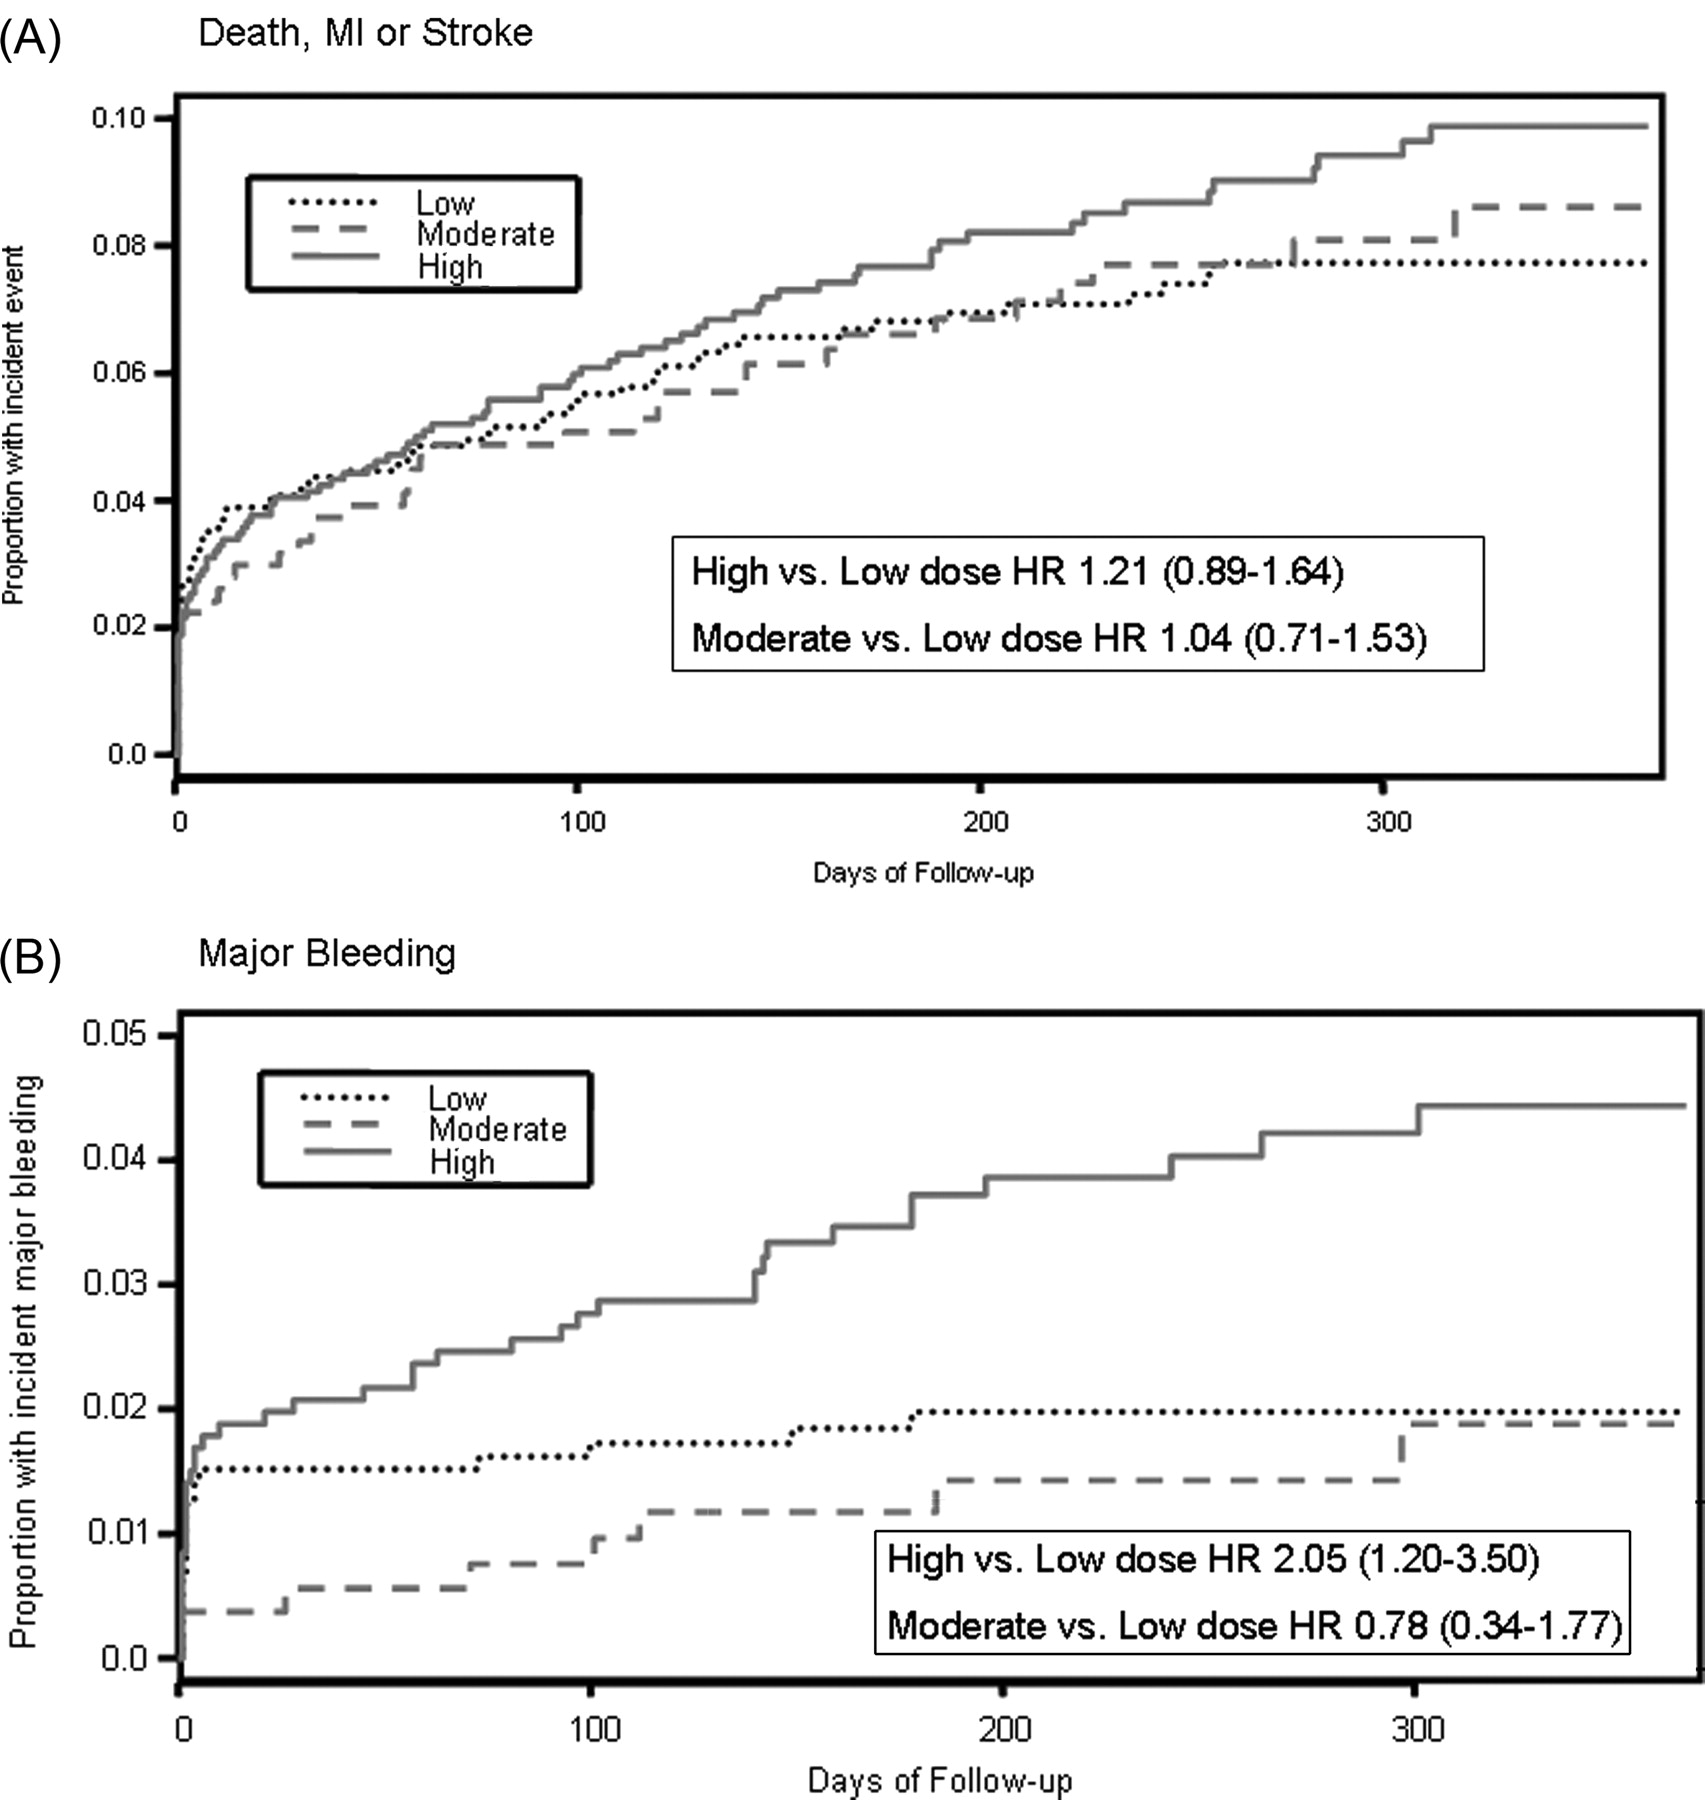
The rates of MI and CV death within 48 h after PCI (peri-procedural) were similar for all three aspirin dose groups (Table 2). The composite of CV death, MI, or stroke at 30 days was similar in the three dose groups with a rate of 4.0% of patients in the high-dose aspirin group vs. 3.2% in the moderate-dose group vs. 4.1% in the low-dose aspirin group [high- vs. low-dose HR 0.99 (0.65–1.51), P = 0.96] and moderate- vs. low-dose HR 0.77 (0.44–1.35), P = 0.37]. At the end of follow-up, CV death, MI, or stroke occurred in 8.6% of the patients on high dose, 7.4% of the patients on moderate dose, and 7.1% on low-dose aspirin [high- vs. low-dose HR 1.21 (0.89–1.64), P = 0.23 and moderate- vs. low-dose HR 1.04 (0.71–1.52), P = 0.85; Figure 2]. After adjustment for covariates, there was no significant difference in efficacy outcomes between the aspirin doses at 30 days as shown in Table 2. The rates of CV death, MI, or stroke taken individually were not significantly different in between the three dose groups in patients undergoing PCI at 30 days and at the end of follow-up (Table 2, Figure 3). The rates of urgent revascularization were also similar at 30 days and long-term follow-up between high-, moderate-, and low-dose groups as shown in Table 2.

(A) Kaplan–Meier event curves for death, myocardial infarction, or stroke at long-term follow-up comparing low-, moderate-, and high-dose aspirin. (B) Kaplan–Meier event curves for major bleeding.
High- vs. low-dose aspirin comparison at long-term follow-up.
Event rates by aspirin dose group at 30 days and long-term follow-up
| Low dose (n = 1056) | Moderate dose (n = 538) | High dose (n = 1064) | HR (95%CI) | Adjusted HRa (95%CI) | |||
|---|---|---|---|---|---|---|---|
| High vs. low dose | Moderate vs. low dose | High vs. low dose | Moderate vs. low dose | ||||
| Outcomes at 48 h | |||||||
| CV death | 4 (0.4%) | 4 (0.7%) | 4 (0.4%) | 0.99 (0.25–3.69) | 1.97 (0.49–7.87) | 0.46 (0.09–2.76) | 1.97 (0.48–8.13) |
| MI | 25 (2.4%) | 8 (1.5%) | 23 (2.2%) | 0.91 (0.32–1.61) | 0.63 (0.28–1.39) | 0.74 (0.34–1.59) | 0.63 (0.27–1.46) |
| Outcomes at 30 days | |||||||
| CV death, MI, or stroke | 43 (4.1%) | 17 (3.2%) | 43 (4.0%) | 0.99 (0.65–1.51) | 0.77 (0.44–1.35) | 0.83 (0.48–1.46) | 0.78 (0.44–1.40) |
| CV death or MI | 40 (3.8%) | 16 (3.0%) | 41 (3.9%) | 1.01 (0.66–1.57) | 0.78 (0.44–1.40) | 0.77 (0.43–1.38) | 0.79 (0.43–1.44) |
| CV death | 7 (0.7%) | 6 (1.1%) | 14 (1.3%) | 1.99 (0.80–4.92) | 1.69 (0.57–5.02) | 1.24 (0.37–4.18) | 1.41 (0.44–4.55) |
| MI | 35 (3.3%) | 11 (2.0%) | 33 (3.1%) | 0.93 (0.58–1.50) | 0.62 (0.31–1.21) | 0.68 (0.36–1.30) | 0.62 (0.30–1.25) |
| Urgent revascularization | 29 (2.8%) | 10 (1.9%) | 24 (2.3%) | 0.82 (0.48–1.41) | 0.67 (0.33–1.38) | 0.91 (0.46–1.82) | 0.58 (0.26–1.28) |
| Major bleeding | 16 (1.5%) | 3 (0.6%) | 22 (2.1%) | 1.37 (0.72–2.63) | 0.37 (0.11–1.26) | 1.42 (0.71–2.82) | 0.51 (0.15–1.78) |
| Net adverse clinical eventsb | 55 (5.2%) | 19 (3.5%) | 62 (5.8%) | 1.13 (0.78–1.64) | 0.67 (0.39–1.13) | 1.02 (0.69–1.51) | 0.81 (0.47–1.39) |
| Outcomes at long-term follow-up | |||||||
| CV death, MI, or stroke | 75 (7.1%) | 40 (7.4%) | 91 (8.6%) | 1.21 (0.89–1.64) | 1.04 (0.71–1.52) | 1.00 (0.67–1.48) | 1.09 (0.73–1.60) |
| CV death or MI | 68 (6.4%) | 36 (6.7%) | 83 (7.8%) | 1.21 (0.88–1.67) | 1.03 (0.69–1.55) | 0.92 (0.61–1.40) | 1.07 (0.71–1.62) |
| CV death | 24 (2.3%) | 13 (2.4%) | 26 (2.4%) | 1.08 (0.62–1.88) | 1.07 (0.54–2.09) | 0.78 (0.37–1.65) | 1.02 (0.50–2.05) |
| MI | 50 (4.7%) | 27 (5.0%) | 67 (6.3%) | 1.33 (0.92–1.92) | 1.05 (0.66–1.68) | 1.02 (0.64–1.64) | 1.11 (0.69–1.80) |
| Urgent revascularization | 29 (2.8%) | 11 (2.0%) | 25 (2.4%) | 0.85 (0.50–1.46) | 0.74 (0.37–1.48) | 0.99 (0.50–1.94) | 0.65 (0.31–1.39) |
| Major bleeding | 20 (1.9%) | 8 (1.5%) | 41 (3.9%) | 2.05 (1.20–3.50) | 0.78 (0.34–1.77) | 2.03 (1.15–3.57) | 0.99 (0.43–2.27) |
| Net adverse clinical eventsb | 89 (8.4%) | 46 (8.6%) | 117 (11.0%) | 1.32 (1.00–1.73) | 1.00 (0.70–1.47) | 1.25 (0.93–1.67) | 1.19 (0.83–1.71) |
aAdjusted analyses for ischaemic outcomes adjusted for: age, gender, weight, hypertension, prior documented coronary stenosis, TIMI risk score components, study drug (clopidogrel), positive biomarker status at randomization, ST-deviation prior to randomization, stent use, and geographic region; adjusted analyses for bleeding and net benefit adjusted for: age, gender, weight, glycoprotein IIb/IIIa use, TIMI risk score components, study drug (clopidogrel), non-steroidal anti-inflammatory drugs, heparin use, oral anticoagulant use, stent use, and coronary artery bypass surgery.
bNet adverse clinical events include death, MI, stroke, or major bleeding.
The impact of clopidogrel in preventing CV death, MI, or stroke was consistent across the three aspirin groups at the end of follow-up [for low-dose group HR 0.63 (0.39–1.00), moderate-dose HR 1.09 (0.59–2.03), and high-dose HR 0.80 (0.53–1.21)]. Aspirin dose did not appear to impact ischaemic events regardless of treatment group (Table 3).
Incidence of death, MI, or stroke within each aspirin dose group by randomized group (clopidogrel and aspirin vs. aspirin and placebo) at long-term follow-up
| Aspirin dose group | Aspirin alone | Aspirin and clopidogrel | Unadjusted HR (95% CI) | Interaction P-value |
|---|---|---|---|---|
| Low | 8.7% | 5.5% | 0.63 (0.39–1.00) | 0.37 |
| Moderate | 7.1% | 7.8% | 1.09 (0.59–2.03) | |
| High | 9.5% | 7.6% | 0.80 (0.53–1.21) | |
| Unadjusted HR of high- vs. low-dose aspirin | 1.09 (0.73–1.62) | 1.39 (0.86–2.24) | ||
| Interaction P-value for high vs. low | 0.38 | |||
| Unadjusted HR of medium- vs. low-dose aspirin | 0.81 (0.47–1.38) | 1.41 (0.80–2.47) | ||
| Interaction P-value for medium vs. low | 0.36 | |||
The rates of coronary artery bypass surgery were similar in the three groups with a rate of 4.7% in the low-dose group, 4.7% in the medium-dose group, and 4.9% in the high-dose group at long-term follow-up.
Safety
At 30 days, 2.1% of the patients in the high-dose group, 0.6% in the moderate-dose group, and 1.5% in the low-dose group had a major bleed [high- vs. low-dose HR 1.37 (0.72–2.63), P = 0.34; moderate- vs. low-dose HR 0.37 (0.11–1.26), P = 0.11; Table 2]. After adjustment for covariates, there was a trend towards a reduction in bleeding with moderate and low-dose aspirin [high- vs. low-dose-adjusted HR 1.42 (0.71–2.82), P = 0.32; moderate- vs. low-dose-adjusted HR 0.51 (0.15–1.78), P = 0.29].
At the end of follow-up, patients treated with high-dose aspirin had a higher rate of major bleeding event than patients on moderate- and low-dose aspirin [3.9, 1.5, and 1.9%, respectively, with high- vs. low-dose HR 2.05 (1.20–3.50), P = 0.009, and moderate- vs. low-dose HR 0.78 (0.34–1.77), P = 0.55]. After adjustment for covariates identified as risk factors for bleeding, there was a significant reduction in bleeding with low-dose aspirin [high- vs. low-dose-adjusted HR 2.03 (1.15–3.57), P = 0.015, and moderate- vs. low-dose-adjusted HR 0.98 (0.43–2.27), P = 0.98] (Table 2). After adjustment for geographic region in addition to the covariates identified as risk factors for bleeding, there was a trend for reduction in major bleeding with low-dose aspirin [high- vs. low-dose adjusted HR 1.70 (0.83–3.41), P = 0.15, and moderate vs. low-dose adjusted HR 0.89 (0.38–2.05), P = 0.78].
When we examined the effect of aspirin dose on major bleeding in the treatment group (clopidogrel) vs. placebo group, it appeared that high-dose aspirin was associated with a greater risk of bleeding in patients who were treated with long-term clopidogrel (Table 4).
Incidence of major bleeding within each aspirin dose group by randomized group (clopidogrel and aspirin vs. aspirin and placebo) at long-term follow-up
| Aspirin dose group | Aspirin alone | Aspirin and clopidogrel | Unadjusted HR (95% CI) | Interaction P-value |
|---|---|---|---|---|
| Low | 2.1% | 1.7% | 0.82 (0.34–1.97) | 0.62 |
| Moderate | 1.5% | 1.5% | 0.98 (0.25–3.92) | |
| High | 3.3% | 4.5% | 1.39 (0.75–2.57) | |
| Unadjusted HR of high- vs. low-dose aspirin | 1.57 (0.74–3.33) | 2.65 (1.23–5.73) | ||
| Interaction P-value for high vs. low | 0.02 | |||
| Unadjusted HR of medium vs. low-dose aspirin | 0.72 (0.23–2.25) | 0.86 (0.27–2.79) | ||
| Interaction P-value for medium vs. low | 0.82 | |||
Net adverse clinical events (composite of death, myocardial infarction, stroke, or major bleeding)
At 30 days, 5.2% of the patients receiving high-dose aspirin experienced CV death, MI, stroke, or major bleeding vs. 3.5% receiving moderate-dose aspirin vs. 5.2% of the patients receiving low-dose aspirin [high- vs. low-dose HR 1.12 (0.78–1.61), P = 0.55, and moderate- vs. low-dose HR 0.67 (0.40–1.13), P = 0.14]. Adjustment for covariates gave similar results [high- vs. low-dose-adjusted HR 1.02 (0.69–1.51), P = 0.91, and moderate- vs. low-dose HR 0.81 (0.47–1.39), P = 0.44; Table 2].
At the end of follow-up, 11.0% of the patients receiving high-dose aspirin experienced a CV death, MI, stroke, or major bleeding event, compared with 8.6% of the patients receiving moderate-dose aspirin and 8.4% receiving low-dose aspirin (high vs. low HR 1.31 (0.99–1.72), P = 0.056, and moderate- vs. low-dose HR 1.00 (0.70–1.43), P = 0.98]. After adjustment, there was a consistent trend towards a reduction in net clinical adverse events for low-dose aspirin [high- vs. low-dose adjusted HR 1.25 (0.93–1.67), P = 0.16, and moderate- vs. low-dose adjusted HR 1.19 (0.83–1.71), P = 0.35 (Table 2)]. After adjustment for geographic region, the difference in net adverse clinical events was no longer seen [high- vs. low-dose adjusted HR 1.12 (0.78–1.60), P = 0.55, and moderate vs. low HR 1.16 (0.81–1.68), P = 0.42].
Discussion
Our study demonstrates that in patients with non-ST-segment elevation ACS undergoing PCI, low-dose aspirin appears to be associated with a similar rate of ischaemic events as higher doses of aspirin but with a lower rate of major bleeding. The net efficacy to safety balance, therefore, favoured lower doses of aspirin in patients undergoing PCI.
Despite aspirin being one of the most commonly used medications for both prevention and treatment of coronary artery disease, there are no adequately powered randomized trials directly comparing aspirin doses. Indirect comparisons of aspirin dose from the Antithrombotic Trialists' Collaboration meta-analysis found no relationship between aspirin dose and efficacy for extracranial major bleeding in the doses ranging from 75 to 1500 mg daily.8 More recently, two observational analyses of randomized trials of patient with ACS demonstrated an increased risk of major bleeding with higher doses of aspirin compared with lower doses with similar rates of ischaemic events.5,6 The majority of patients in these studies did not undergo PCI, highlighting the lack of comparative data evaluating aspirin dose to guide physicians as to the most appropriate dose of aspirin following PCI.
Aspirin irreversibly acetylates cyclo-oxygenase 1 and thus blocks the production of prostaglandin G2 and thromboxane A2. Doses as little as 50 mg of aspirin chronically have been shown to block thromboxane synthesis sufficiently by platelets.21,22 The inhibition of cyclo-oxygenase 1 in gastric mucosal cells by aspirin decreases the production of cytoprotective prostaglandins and thus may increase the risk of gastrointestinal bleeding.7 However, unlike platelets, gastric mucosal cells have the ability to produce unacetlylated cyclo-oxygenase 1 suggesting that aspirin dose is important with regard to gastric toxicity.7,23
Our analysis suggests that the utilization of lower doses of aspirin can partially offset the higher bleeding risk when aspirin is used in combination with clopidogrel after PCI, with no loss in efficacy compared with using higher doses of aspirin. These findings are consistent with observational analyses in primarily non-PCI populations, demonstrating improved safety and similar efficacy with low-dose aspirin,5,6 and with a recent observational analysis, suggesting that rates of stent thrombosis after drug-eluting stent implantation were similar with low- and high-dose aspirin.24 Furthermore, a number of drug-eluting stent trials have used aspirin doses of 100 mg/day routinely.25,26 Major bleeding has been shown to be associated with higher rates of mortality in several large-scale observational analyses.20,27 The avoidance of major bleeding is important in the management of ACS, especially with more potent antiplatelet agents such as prasugrel.28 Our study suggests that replacing the routine use of high-dose aspirin with lower doses of aspirin will reduce the risk of major bleeding by ∼20–25% and enhance the net efficacy–safety balance in the management of patients after PCI. This becomes even more important with longer durations of dual antiplatelet therapy after PCI, such as with the use of drug-eluting stents to prevent late stent thrombosis.29
Limitations
The main limitation of this study is that it is based on a post hoc observational analysis and the results may have been influenced by potential confounding variables. Specifically, we cannot rule out entirely that differences in aspirin dosing by geographic region confound the results of this study. In order to partially offset this, we extensively adjusted both the efficacy and safety results with multivariable models and included geographic region in our models. Furthermore, our data are externally consistent with a large body of observational data in patients not undergoing PCI.8 Due to the limitations of observational analyses, randomized trials comparing low and high-dose aspirin after PCI are needed.
In conclusion, the results of our study show that, in patients undergoing PCI, lower doses of aspirin (<200 mg/day) are associated with similar efficacy but lower rates of major bleeding compared with higher doses of aspirin (≥200 mg) in patients with ACS. This suggests that lower doses of aspirin may be optimal after PCI for patient safety.
Funding
The PCI-CURE study was supported by a research grant from Sanofi-Synthelabo and Bristol-Myers-Squibb.
Conflict of interest: none declared.
Acknowledgement
We thank Feng Zhao for statistical support.

