


Abstract
To assess long-term (78 weeks) alirocumab treatment in patients with heterozygous familial hypercholesterolaemia (HeFH) and inadequate LDL-C control on maximally tolerated lipid-lowering therapy (LLT).
In two randomized, double-blind studies (ODYSSEY FH I, n = 486; FH II, n = 249), patients were randomized 2 : 1 to alirocumab 75 mg or placebo every 2 weeks (Q2W). Alirocumab dose was increased at Week 12 to 150 mg Q2W if Week 8 LDL-C was ≥1.8 mmol/L (70 mg/dL). Primary endpoint (both studies) was percentage change in calculated LDL-C from baseline to Week 24. Mean LDL-C levels decreased from 3.7 mmol/L (144.7 mg/dL) at baseline to 1.8 mmol/L (71.3 mg/dL; −57.9% vs. placebo) at Week 24 in patients randomized to alirocumab in FH I and from 3.5 mmol/L (134.6 mg/dL) to 1.8 mmol/L (67.7 mg/dL; −51.4% vs. placebo) in FH II (P < 0.0001). These reductions were maintained through Week 78. LDL-C <1.8 mmol/L (regardless of cardiovascular risk) was achieved at Week 24 by 59.8 and 68.2% of alirocumab-treated patients in FH I and FH II, respectively. Adverse events resulted in discontinuation in 3.4% of alirocumab-treated patients in FH I (vs. 6.1% placebo) and 3.6% (vs. 1.2%) in FH II. Rate of injection site reactions in alirocumab-treated patients was 12.4% in FH I and 11.4% in FH II (vs. 11.0 and 7.4% with placebo).
In patients with HeFH and inadequate LDL-C control at baseline despite maximally tolerated statin ± other LLT, alirocumab treatment resulted in significant LDL-C lowering and greater achievement of LDL-C target levels and was well tolerated.
Cinicaltrials.gov (identifiers: NCT01623115; NCT01709500).
Introduction
Heterozygous familial hypercholesterolaemia (HeFH) is the most common autosomal dominant genetic disorder, with an estimated prevalence of 1 : 200 to 1 : 500 in the general population.1 Patients with HeFH are characterized by elevated levels of LDL-C. Exposure to high LDL-C levels from birth in HeFH is associated with a markedly increased risk for cardiovascular (CV) events. Before the advent of statin use, the risk of CV events was reported to be 100-fold greater in patients with HeFH (aged 20–39 years) than the general population.2 The risk of CV events was still greatly elevated 8 years later, despite widespread use of statins.3 In two observational studies,4,5 ∼80% of adult patients with HeFH did not achieve an LDL-C level of <2.5 mmol/L (∼100 mg/dL) despite treatment with maximum doses of statins (and addition of ezetimibe in many cases). An LDL-C level of <1.8 mmol/L (70 mg/dL) is recommended for patients with HeFH who are at very high CV risk (i.e. established coronary heart disease [CHD], diabetes, or for previously untreated individuals >40 years old).1
Inhibition of proprotein convertase subtilisin/kexin type 9 (PCSK9) represents a potential means of reducing LDL-C levels.6 Previously, alirocumab was assessed in a small (n = 77) dose-ranging study in patients with HeFH.7 The current report describes results of two Phase 3 studies that evaluated the efficacy and safety of the fully human monoclonal PCSK9 antibody alirocumab over 78 weeks in patients with HeFH.
Methods
ODYSSEY FH I and FH II were randomized, double-blind, placebo-controlled Phase 3 studies with similar designs.8 FH I was performed at 89 sites across North America, Europe, and South Africa; FH II was performed across 26 sites in Europe. Study protocols were approved by the relevant institutional review boards or independent ethics committees. All patients provided written informed consent.
Patients
Patients with HeFH who did not have a history of CV events, and those who had suffered a myocardial infarction (MI) or ischaemic stroke, were both eligible for participation if their LDL-C levels were not at goal according to current guidelines9 for primary [≥2.6 mmol/L (100 mg/dL)] or secondary [≥1.8 mmol/L (70 mg/dL)] prevention, respectively. HeFH diagnosis was either by genotyping or clinical criteria (Simon Broome criteria or World Health Organization/Dutch Lipid Network criteria with a score of >8 points). All patients were receiving stable high-dose statin therapy (rosuvastatin 20–40 mg, atorvastatin 40–80 mg, or simvastatin 80 mg; lower doses were allowed with an investigator-documented justification, e.g. intolerance to higher statin doses), with or without other lipid-lowering therapy (LLT), for at least 4 weeks prior to screening (6 weeks for fenofibrate; fibrates other than fenofibrate were not allowed). Patients with known homozygous FH or fasting serum triglyceride levels >4.5 mmol/L (400 mg/dL) were excluded. Further exclusion criteria are given in the Supplementary material online.
Study procedures
Patients were randomized in a 2 : 1 fashion to receive either alirocumab 75 mg every 2 weeks (Q2W) or placebo. Randomization was stratified by history of MI or ischaemic stroke, statin treatment (atorvastatin 40–80 mg or rosuvastatin 20–40 mg daily vs. simvastatin whatever the daily dose, atorvastatin <40 mg daily, or rosuvastatin <20 mg daily), and geographic region (FH I only). The dose of alirocumab was increased in a blinded fashion to 150 mg Q2W at Week 12 if the patient's LDL-C level at Week 8 was ≥1.8 mmol/L (70 mg/dL). Alirocumab 75 and 150 mg doses and placebo were each administered as a single 1 mL subcutaneous injection using a prefilled pen. Each patient (or their caregiver) was trained to administer injections at home. Throughout the study, patients continued with their stable statin dose and other LLT and were instructed to follow a stable National Cholesterol Education Program Adult Treatment Panel III Therapeutic Lifestyle Changes diet or equivalent.
At the end of the 78 week treatment period in each study, patients were given the option to enter a 3 year open-label extension study (currently ongoing) in which all patients are administered alirocumab. If patients decided not to enter the open-label treatment period, they were followed up for 8 weeks post-treatment.
All lipid measurements and laboratory tests were performed using standard procedures by a central laboratory (see Supplementary material online).
Endpoints
The primary endpoint for both studies was the per cent change in calculated LDL-C from baseline to Week 24. This was analysed using an intention-to-treat (ITT) approach, including values obtained after stopping treatment in patients who discontinued therapy. Secondary endpoints are listed in the Supplementary material online and include the per cent change in LDL-C levels in an on-treatment analysis (using measurements that were collected while patients were still receiving treatment) as well as the proportion of patients reaching calculated LDL-C <2.6 mmol/L (for those without prior CV events) and <1.8 mmol/L (for those with prior CV events) at Week 24; the proportion of patients reaching LDL-C <1.8 mmol/L regardless of prior CV events was also calculated.
Safety was assessed through adverse events reports, laboratory data, electrocardiogram, and vital signs. Treatment-emergent adverse events (TEAEs) were defined as any adverse event that developed, worsened, or became serious during the period from first to last injection plus 70 days (or to the first injection in the open-label extension, whichever came first). CV events and deaths were adjudicated by an independent Clinical Events Committee.
Development of anti-drug antibodies (ADAs) to alirocumab was assessed in all patients. Samples were collected at clinic visits prior to study-drug administration, at Weeks 0, 12, 24, 52, and 78, and at follow-up visit and were assessed using a validated assay by Regeneron Pharmaceuticals, Inc. (Tarrytown, NY, USA). The cut-points for the ADA assay were generated using baseline samples from the patient population and incorporated false-positive rates recommended by both industry Whitepapers and agency guidelines (see references in Supplementary material online).
Statistical analysis
A total sample size of 45 patients (30 in the alirocumab and 15 in the placebo group) was calculated to provide 95% power to detect a difference in mean per cent change in LDL-C of 30% with a 0.05 two-sided significance level, assuming a common standard deviation of 25% and all 45 patients having an evaluable primary endpoint. Nevertheless, to meet regulatory requirements across the program, sample size was increased to 471 (FH I) and 250 (FH II) to assess the safety of alirocumab in a larger population (see Supplementary material online).
The ITT analysis included all randomized patients with an LDL-C measurement available at baseline and at least one of the post-randomization time points between Weeks 4 and 24, regardless of treatment adherence. Details on statistical analysis of efficacy endpoints are given in Supplementary material online.
Results
Patients
A total of 735 patients were randomized in the two studies: 486 in FH I (323 to alirocumab and 163 to placebo) and 249 in FH II (167 to alirocumab and 82 to placebo; Figure 1). Baseline characteristics were well balanced between groups in the individual studies, with some differences noted between the studies (e.g. in percentage diagnosed by genotyping; Table 1). Prior CHD was reported in 46% of patients in FH I and 36% in FH II, and CHD risk equivalents were present in 16 and 8%, respectively (see Supplementary material online, Table S1 for further details). Over 80% of patients were receiving high-dose statin, and over half were also receiving ezetimibe 10 mg (Table 1). In FH I and FH II, respectively, 85.8 and 91.6% of alirocumab-treated patients (87.7 and 90.1% of placebo) received study treatment for ≥76 weeks.
Baseline characteristics (randomized population)
| FH I | FH II | |||
|---|---|---|---|---|
| Alirocumab (n = 323) | Placebo (n = 163) | Alirocumab (n = 167) | Placebo (n = 82) | |
| Diagnosis of heterozygous familial hypercholesterolaemia, n (%) | ||||
| Genotyping | 129 (39.9) | 62 (38.0) | 117 (70.1) | 66 (80.5) |
| Clinical criteriaa | 193 (59.8) | 101 (62.0) | 50 (29.9) | 16 (19.5) |
| Age, years, mean ± SD | 52.1 ± 12.9 | 51.7 ± 12.3 | 53.2 ± 12.9 | 53.2 ± 12.5 |
| Male, n (%) | 180 (55.7) | 94 (57.7) | 86 (51.5) | 45 (54.9) |
| Race, White, n (%) | 300 (92.9) | 144 (88.3) | 164 (98.2) | 80 (97.6) |
| Body mass index, kg/m2, mean ± SD | 29.0 ± 4.6 | 30.0 ± 5.4 | 28.6 ± 4.6 | 27.7 ± 4.7 |
| Coronary heart disease, n (%)b | 147 (45.5) | 78 (47.9) | 58 (34.7) | 31 (37.8) |
| Coronary heart disease risk equivalents, n (%)c | 54 (16.7) | 25 (15.3) | 15 (9.0) | 4 (4.9) |
| Current smoker, n (%) | 39 (12.1) | 30 (18.4) | 36 (21.6) | 13 (15.9) |
| Hypertension, n (%) | 139 (43.0) | 71 (43.6) | 57 (34.1) | 24 (29.3) |
| Type 2 diabetes, n (%)d | 32 (9.9) | 25 (15.3) | 7 (4.2) | 3 (3.7) |
| Statin use, n (%) | 323 (100) | 163 (100) | 167 (100) | 82 (100) |
| High-dose statin use, n (%)e | 267 (82.7) | 139 (85.3) | 145 (86.8) | 75 (91.5) |
| Ezetimibe use | 181 (56.0) | 97 (59.5) | 112 (67.1) | 53 (64.6) |
FH I was conducted in North America, Europe, and South Africa; FH II was conducted in Europe. P-values comparing baseline data between treatment groups were calculated for descriptive purposes, and no difference was significant at the 5% level.
aOne patient (randomized to the alirocumab arm in FH I) was characterized using clinical (World Health Organization) criteria as ‘probable’ HeFH rather than ‘certain’; however, subsequent genotyping failed to identify a mutation in the LDLR or APOB genes; rare mutations cannot be excluded. The patient was considered as having HeFH by the investigator.
bAcute myocardial infarction, silent myocardial infarction, unstable angina, or coronary revascularization.
cIschaemic stroke, peripheral arterial disease, moderate chronic kidney disease (estimated glomerular filtration rate of ≥30 and ≤60 mL/min/1.73 m2), and diabetes with two or more risk factors.
dBased on medical history.
eAtorvastatin 40–80 mg, rosuvastatin 20–40 mg, or simvastatin 80 mg daily.
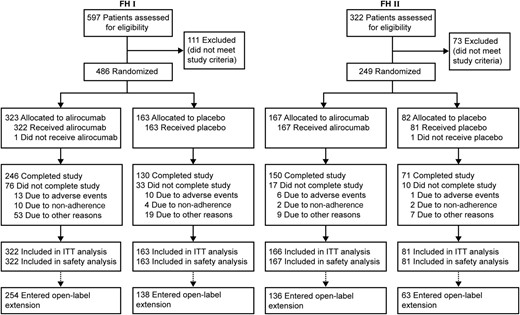
Randomization and treatment. ITT, intention-to-treat. Completion of the study was defined as follows: last study-drug injection received (Week 76) and end-of-treatment visit (Week 78) occurred within 21 days of last injection and at least 525 days post-randomization.
Efficacy
In FH I, mean baseline LDL-C levels of 3.7 mmol/L (144.7 mg/dL) were reduced to 1.8 mmol/L (71.3 mg/dL) at Week 24 in patients randomized to alirocumab (placebo-corrected LDL-C reduction of 57.9%; P < 0.0001). In FH II, mean baseline LDL-C levels of 3.5 mmol/L (134.6 mg/dL) were reduced to 1.8 mmol/L (67.7 mg/dL) with alirocumab (placebo-corrected LDL-C reduction of 51.4%; P < 0.0001; Table 2). LDL-C reductions were maintained through Weeks 4–78 (Figure 2; data listed in mmol/L and mg/dL in Supplementary material online, Table S2). After 78 weeks of treatment, mean LDL-C levels were 2.2 mmol/L (84.0 mg/dL) in FH I (51.8% reduction from baseline vs. placebo) and 1.8 mmol/L (69.7 mg/dL) in FH II (52.1% reduction from baseline vs. placebo). The on-treatment analysis of calculated LDL-C per cent change from baseline to Week 24 showed very consistent results with the ITT analysis (see Supplementary material online, Table S3). In order to assess potential impact of missing data, a sensitivity analysis of the primary endpoint using a pattern-mixture model was conducted and gave results consistent with the primary analysis (see Supplementary material online, Table S4).
Primary and selected secondary efficacy endpoints (intention-to-treat analysis)
| FH I | FH II | |||||
|---|---|---|---|---|---|---|
| Alirocumab (n = 322) | Placebo (n = 163) | % Difference vs. placebo | Alirocumab (n = 166) | Placebo (n = 81) | % Difference vs. placebo | |
| Calculated LDL-C, LS mean ± SE | ||||||
| Baseline, mmol/L [mg/dL] | 3.7 ± 0.1 [144.7 ± 2.9] | 3.7 ± 0.1 [144.4 ± 3.7] | 3.5 ± 0.1 [134.6 ± 3.2] | 3.5 ± 0.1 [134.0 ± 4.6] | ||
| Week 24, mmol/L [mg/dL] | 1.8 ± 0.1 [71.3 ± 2.3] | 4.0 ± 0.1 [155.6 ± 3.2] | 1.8 ± 0.1 [67.7 ± 2.8] | 3.5 ± 0.1 [136.6 ± 4.0] | ||
| % Change from baseline to Week 24 (primary endpoint) | −48.8 ± 1.6 | 9.1 ± 2.2 | −57.9 ± 2.7** | −48.7 ± 1.9 | 2.8 ± 2.8 | −51.4 ± 3.4** |
| 95% confidence interval | −63.3 to −52.6 | −58.1 to −44.8 | ||||
| Selected secondary efficacy endpoints | ||||||
| Patients (%) with or without prior CV events achieving LDL-C <1.8 mmol/L (<70 mg/dL) or <2.6 mmol/L (<100 mg/dL), respectively, at Week 24 | 72.2** | 2.4 | 81.4** | 11.3 | ||
| Patients (%) achieving LDL-C <1.8 mmol/L at Week 24 (regardless of prior CV events) | 59.8** | 0.8 | 68.2** | 1.2 | ||
| Calculated LDL-C % change from baseline to Week 12, LS mean ± SE | −43.5 ± 1.4 | 5.7 ± 2.0 | −49.2 ± 2.4** | −43.8 ± 1.8 | 4.6 ± 2.6 | −48.4 ± 3.2** |
| % Change from baseline to Week 24 in secondary lipid variables, LS mean ± SE | ||||||
| Apolipoprotein B | −41.1 ± 1.2 | 4.7 ± 1.6 | −45.8 ± 2.0** | −42.8 ± 1.4 | −3.5 ± 2.0 | −39.3 ± 2.4** |
| Non-HDL-C | −42.8 ± 1.4 | 9.6 ± 2.0 | −52.4 ± 2.4** | −42.6 ± 1.8 | 3.1 ± 2.5 | −45.7 ± 3.1** |
| Lipoprotein(a) | −25.2 ± 1.4 | −7.5 ± 2.0 | −17.7 ± 2.5** | −30.3 ± 1.8 | −10.0 ± 2.5 | −20.3 ± 3.1** |
| Fasting triglycerides | −9.6 ± 1.6 | 6.3 ± 2.2 | −16.0 ± 2.7** | −10.4 ± 2.0 | 0.5 ± 2.8 | −10.9 ± 3.4* |
| HDL-C | 8.8 ± 0.9 | 0.8 ± 1.2 | 8.0 ± 1.5** | 6.0 ± 1.2 | −0.8 ± 1.6 | 6.8 ± 2.0* |
| Apolipoprotein A1 | 5.0 ± 0.7 | 0.3 ± 1.0 | 4.7 ± 1.2* | 2.8 ± 0.9 | −1.6 ± 1.3 | 4.4 ± 1.6* |
LS, least squares.
*P < 0.05; **P < 0.0001 vs. placebo.
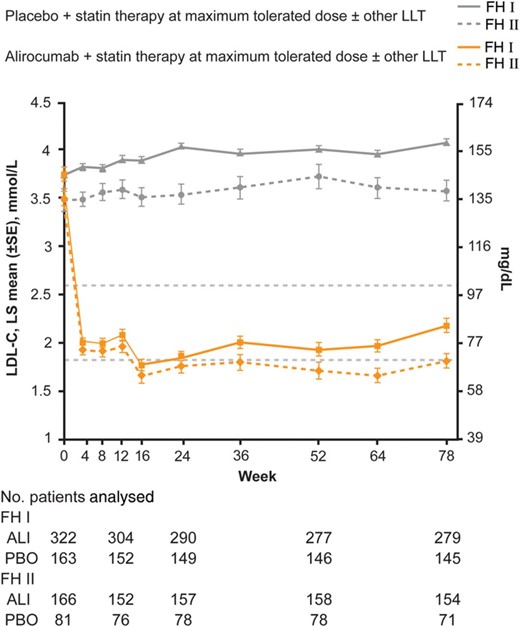
Levels of calculated LDL-C over time (intention-to-treat analysis). ALI, alirocumab; PBO, placebo.
An LDL-C level of <1.8 mmol/L was achieved by 59.8% of patients (regardless of prior CV events) randomized to alirocumab in FH I (vs. 0.8% placebo) and 68.2% of alirocumab-treated patients in FH II (vs. 1.2% placebo) at Week 24 (Table 2). Achievement of LDL-C levels of <1.8 or <2.6 mmol/L according to CV risk is shown in Table 2. Significant reductions vs. placebo in apolipoprotein B, non-HDL-C, lipoprotein(a), and triglycerides as well as increases in HDL-C and apolipoprotein A1 were also observed following alirocumab treatment in both studies (Table 2; baseline values in Supplementary material online, Table S5).
Per cent reductions in LDL-C at Week 12 (before potential dose increase) are shown in Table 2. Among patients who received double-blind treatment for at least 12 weeks, 176/311 (56.6%) in FH I and 97/158 (61.4%) in FH II had LDL-C levels <1.8 mmol/L at Week 8 and were maintained on alirocumab 75 mg Q2W. LDL-C levels were stable over time in these patients (see Supplementary material online, Figure S1). For patients in FH I who received dose increase to 150 mg Q2W, mean LDL-C levels were 2.7 mmol/L (104.3 mg/dL) at Week 12 and 2.0 mmol/L (78.5 mg/dL) at Week 24. Corresponding values in FH II were 2.6 mmol/L (98.6 mg/dL) at Week 12 and 1.9 mmol/L (71.8 mg/dL) at Week 24. The additional percentage reduction in LDL-C following dose increase (i.e. comparing Week 12 to Week 24) was 15.1% in FH I and 16.9% in FH II.
Subgroup analyses of the primary efficacy endpoint showed consistent reduction of calculated LDL-C across a range of demographic and baseline characteristics (Supplementary material online, Figure S2). The percentage reduction in LDL-C (alirocumab vs. placebo) was 60.1% in males and 50.6% in females (pooled data from FH I and FH II), with a P-value for interaction of 0.0267. In the individual studies, LDL-C reductions (vs. placebo) were 62.6% for males and 51.9% for females in FH I and 53.5% for males and 49.2% for females in FH II.
Safety
The percentage of patients who experienced TEAEs, serious AEs, and TEAEs leading to treatment discontinuation were comparable between treatment groups in the individual studies (Table 3; further details shown in Supplementary material online, Tables S6 and S7). Positively adjudicated CV events were reported in eight (2.5%) alirocumab-treated patients and three (1.8%) placebo patients in FH I and in two (1.2%) alirocumab-treated patients and one (1.2%) placebo patient in FH II. Six deaths (1.9%) were reported in the alirocumab group of FH I (no deaths were reported in the FH I placebo arm or in FH II). Events leading to death were metastatic cancer in two patients (non-small cell lung cancer and pancreatic cancer, diagnosed at 2.5 and 7.5 months following randomization, respectively), acute MI in one patient, colonic pseudo-obstruction following an abdominal surgery in one patient, and sudden cardiac death in two patients (congestive cardiac failure and coronary artery disease for the first death, and MI for the second death). Narratives are given in the Supplementary material online.
Treatment-emergent adverse events and laboratory values (safety population)
| FH I | FH II | |||
|---|---|---|---|---|
| Alirocumab (n = 322) | Placebo (n = 163) | Alirocumab (n = 167) | Placebo (n = 81) | |
| TEAEs | 263 (81.7) | 129 (79.1) | 125 (74.9) | 66 (81.5) |
| Treatment-emergent SAEs | 44 (13.7) | 22 (13.5) | 15 (9.0) | 8 (9.9) |
| TEAEs leading to deatha | 6 (1.9) | 0 | 0 | 0 |
| TEAEs leading to treatment discontinuation | 11 (3.4) | 10 (6.1) | 6 (3.6) | 1 (1.2) |
| TEAEs occurring in ≥5% patients (in any group) | ||||
| Injection site reaction | 40 (12.4) | 18 (11.0) | 19 (11.4) | 6 (7.4) |
| Fisher's exact test P-valueb | 0.77 | 0.38 | ||
| Nasopharyngitis | 36 (11.2) | 12 (7.4) | 21 (12.6) | 18 (22.2) |
| Upper respiratory tract infection | 22 (6.8) | 14 (8.6) | 5 (3.0) | 1 (1.2) |
| Arthralgia | 20 (6.2) | 9 (5.5) | 8 (4.8) | 7 (8.6) |
| Influenza | 20 (6.2) | 10 (6.1) | 24 (14.4) | 7 (8.6) |
| Back pain | 18 (5.6) | 7 (4.3) | 12 (7.2) | 6 (7.4) |
| Sinusitis | 17 (5.3) | 7 (4.3) | 1 (0.6) | 2 (2.5) |
| Headache | 15 (4.7) | 9 (5.5) | 16 (9.6) | 7 (8.6) |
| Diarrhoea | 10 (3.1) | 5 (3.1) | 11 (6.6) | 1 (1.2) |
| Bronchitis | 10 (3.1) | 9 (5.5) | 4 (2.4) | 1 (1.2) |
| Dizziness | 7 (2.2) | 6 (3.7) | 8 (4.8) | 5 (6.2) |
| Myalgia | 6 (1.9) | 11 (6.7) | 10 (6.0) | 5 (6.2) |
| Influenza like illness | 6 (1.9) | 1 (0.6) | 9 (5.4) | 5 (6.2) |
| Safety events of interest | ||||
| Positively adjudicated CV events | 8 (2.5) | 3 (1.8) | 2 (1.2) | 1 (1.2) |
| General allergic TEAEsc | 28 (8.7) | 16 (9.8) | 19 (11.4) | 5 (6.2) |
| Neurological TEAEsc | 12 (3.7) | 7 (4.3) | 7 (4.2) | 2 (2.5) |
| Neurocognitive disordersc | 2 (0.6) | 2 (1.2) | 0 | 1 (1.2) |
| Development/worsening of diabetesc | 6 (1.9) | 4 (2.5) | 4 (2.4) | 2 (2.5) |
| Ophthalmologic disordersc | 3 (0.9) | 4 (2.5) | 3 (1.8) | 1 (1.2) |
| Alanine aminotransferase >3 × ULN | 5/322 (1.6) | 2/163 (1.2) | 6/166 (3.6) | 1/81 (1.2) |
| Creatine kinase >3 × ULN | 13/318 (4.1) | 10/163 (6.1) | 8/165 (4.8) | 6/80 (7.5) |
Values are n (%).
TEAE, treatment-emergent adverse event; SAE, serious adverse event; ULN, upper limit of normal.
aSix deaths occurred in the alirocumab group in FH I during study treatment, two due to metastatic cancer (non-small cell lung cancer and pancreatic carcinoma with secondary Trousseau syndrome causing multiple embolic strokes), one due to acute MI, two classified as due to sudden cardiac death (congestive cardiac failure and coronary artery disease for the first death, and MI for the second), and one due to colonic pseudo-obstruction following abdominal surgery.
bP-values for descriptive purpose only and not adjusted for multiplicity.
cSelection of preferred terms based on Custom Medical Dictionary for Regulatory Activities queries as shown in the Supplemental material online.
A higher proportion of patients experienced injection site reactions in the alirocumab groups vs. placebo in FH I (12.4 vs. 11.0%) and FH II (11.4 vs. 7.4%). Most of the injection site reactions were classified as mild in intensity. No injection site reaction led to study drug discontinuation. None of the reported neurological or allergic events (Table 3) were serious. Pruritus was reported in two (0.6%) and three (1.8%) alirocumab-treated patients in FH I and II, respectively, and one placebo-treated patient in each study (0.6 and 1.2%, respectively). Few neurocognitive events were reported with alirocumab [2 (0.6%) in FH I and none in FH II] or placebo [2 (1.2%) in FH I, 1 (1.2%) in FH II; Table 3].
Among alirocumab-treated patients, 20 (6.2%) in FH I and 12 (7.2%) in FH II had calculated LDL-C levels of <0.65 mmol/L (<25 mg/dL) on at least two consecutive occasions. No specific safety concerns were identified in these patients. Alanine transaminase levels over three times the upper limit of normal were observed in 1.6 and 3.6% alirocumab-treated patients in FH I and FH II, respectively, compared with 1.2% placebo patients in both studies (Table 3; further details in Supplementary material online, Table S8). There were no differences between alirocumab and placebo groups in terms of vital signs parameters except for a higher proportion of patients with elevated systolic blood pressure in the FH II alirocumab group (11.4%) vs. placebo (6.2%) (see Supplementary material online, Table S9). There were no changes of note over the course of the study in either HbA1c or estimated glomerular filtration rate (Supplementary material online, Tables S10 and S11).
Anti-drug antibodies
Treatment-emergent ADA responses were observed in 17 (5.5%) alirocumab and one (0.6%) placebo-treated patient in FH I and 14 (8.6%) alirocumab and one (1.3%) placebo-treated patient in FH II. Six (1.8%) of these patients in FH I and three (1.8%) in FH II had such a response on two or more consecutive sampling points. Median time to onset of treatment-emergent ADA responses in alirocumab-treated patients was 12 weeks in FH I and FH II. Three patients [two (0.6%) in FH I and one (0.6%) in FH II] had positive alirocumab-neutralizing antibody status at a single occasion (all at Week 12). In one patient with a positive neutralizing status, a transient decline in efficacy was detected; however, by Week 16, LDL-C levels were reduced by 66% from baseline. This reduction was maintained to end of study. LDL-C reduction was not affected in the other two patients with positive neutralizing status. No specific safety pattern was observed in ADA-positive patients.
Discussion
In patients with HeFH with inadequately controlled LDL-C levels despite maximally tolerated statin with or without other LLT, self-administered alirocumab reduced LDL-C levels from baseline by 57.9% (FH I) and 51.4% (FH II), vs. placebo, at Week 24. Alirocumab was generally well tolerated over 78 weeks of treatment, with consistent LDL-C reductions observed throughout the study. Although mean LDL-C levels were >3.5 mmol/L at baseline, 56.6 and 61.4% of patients in FH I and FH II, respectively, did not require dose increase at Week 8 and were maintained on the dose regimen of alirocumab 75 mg Q2W. Furthermore, the majority of alirocumab-treated patients achieved LDL-C levels of <1.8 mmol/L at Week 24 (59.8% in FH I and 68.2% in FH II).
LDL-C levels achieved in patients with HeFH have continued to improve over the years as new lipid-lowering treatments become available. In the first simvastatin trial, baseline LDL-C levels of 9.6 mmol/L (371 mg/dL) were reduced to ∼5.2 mmol/L (200 mg/dL) with treatment.10 With the advent of more potent statins and the addition of ezetimibe, LDL-C control has improved further.11 However, in recent studies, ∼80% of patients did not achieve an LDL-C level of <2.5 mmol/L.4,5 In FH I and FH II, baseline LDL-C levels of 3.5–3.7 mmol/L (135–145 mg/dL) were reduced to 1.8 mmol/L (68–71 mg/dL), consistent with alirocumab Phase 1 and 2 trials in patients with HeFH.7,12 Data from the FH I and II studies demonstrate that PCSK9 inhibitors in addition to statins could for the first time enable many patients with HeFH to achieve the specific LDL-C goals suggested for individuals in the general population at risk for CVD.9 However, given the chronic nature of this disease, further studies of even longer duration are warranted.
In studies including mostly patients with non-familial hypercholesterolaemia (non-FH), alirocumab 75 mg Q2W (with possible dose increase to 150 mg Q2W) reduced LDL-C by 48.2% (vs. 2.3% with placebo)13 and 50.6% (vs. 20.7% with ezetimibe),14 consistent with reductions observed in FH I and FH II. Furthermore, in a subgroup analysis of the ODYSSEY LONG TERM study, alirocumab dosed at 150 mg Q2W reduced LDL-C levels by a similar extent in both patients with HeFH (−56.3 vs. +7.0% with placebo) and those with non-FH (−62.1 vs. −0.5% with placebo).15
Subgroup analyses of FH I and FH II indicated larger percentage reductions in LDL-C observed in males compared with females, with the difference more prominent in FH I. However, the degree of LDL-C lowering was still substantial for both sexes. Similar mild heterogeneity in LDL-C reductions between sexes was reported in previous alirocumab studies that included both patients with HeFH and non-FH14,15 and also in studies of other PCSK9 inhibitors.16 Reasons for this heterogeneity are unclear at the present time.
As expected based on reductions in LDL-C, alirocumab also reduced levels of apolipoprotein B and non-HDL-C. Plasma levels of Lp(a) were also significantly reduced. Lp(a) is an independent CV risk factor, with levels reported to be higher in patients with FH compared with controls.17 Statins have minimal if any effect on Lp(a); however, reductions of 20.5–30.3% have been reported with alirocumab treatment.13–15,18
With regards to safety, a higher rate of injection site reactions was reported with alirocumab compared with placebo in both studies, although these were transient, non-serious events. Transient neutralizing antibodies were reported in three patients. Overall, data in these patients do not suggest a correlation between neutralizing antibodies and LDL-C-lowering efficacy or safety, consistent with a previous report.13 Six deaths were reported in the alirocumab group in FH I; however, there was no pattern and no deaths were felt to be drug related. However, neither FH I nor FH II was powered for analysis of deaths or CV events, and current data are insufficient to draw conclusions on the effect of alirocumab on incidence of such events. In a 2341 patient 78 week study of alirocumab 150 mg Q2W on background of maximally tolerated statin with or without other LLTs (ODYSSEY LONG TERM), there were fewer deaths in alirocumab-treated patients compared with placebo. Furthermore, a post hoc analysis of ODYSSEY LONG TERM indicated a lower rate of major adverse CV events with alirocumab.15 The effect of alirocumab on CV events is being assessed in the large 18 000 patient ODYSSEY OUTCOMES trial (NCT01663402).
The FHI and II studies build on previous work from a smaller study7 and evaluated alirocumab over 18 months, the longest double-blind treatment period to date with a PCSK9 inhibitor in patients with HeFH. FH I and II demonstrated that alirocumab on top of maximally tolerated statin produced sustained and clinically significant reductions in LDL-C, with the majority of patients achieving LDL-C <1.8 mmol/L. Alirocumab was well-tolerated in a large population of patients.
Supplementary material
Supplementary material is available at European Heart Journal online.
Funding
This work was supported by Sanofi and Regeneron Pharmaceuticals, Inc. Funding to pay the Open Access publication charges for this article was provided by Regeneron Pharmaceuticals, Inc., and Sanofi.
Conflict of interest: J.J.P.K. has received consulting fees from Cerenis, The Medicines Company, CSL Behring, Amgen, Regeneron Pharmaceuticals, Inc., Eli Lilly, Genzyme, Aegerion, Esperion, AstraZeneca, Omthera, Pronova, Vascular Biogenics, Boehringer Ingelheim, Catabasis, AtheroNova, UniQure, Novartis, Merck, Isis Pharmaceuticals, Kowa, Dezima Pharmaceuticals, and Pfizer. H.N.G. has received research grants and personal fees (Steering Committee Chair) from Sanofi and Regeneron Pharmaceuticals, Inc., and a research grant and advisory board fees from Amgen. G.L.'s institution received compensation from the study sponsor (Sanofi) for conduct of the study. G.L. has received advisory board fees from Amgen, Sanofi, and Janssen Pharmaceuticals. G.K.H.'s institution has received payment for conducting clinical trials from Sanofi, Regeneron Pharmaceuticals, Inc., Amgen, Pfizer, Kowa, Genzyme, Isis Pharmaceuticals, Roche, Eli Lilly, Aegerion, Synageva, and AstraZeneca and for lectures and/or advisory panel participation of GKH from Amgen, Sanofi, Pfizer, and Roche. R.C. has nothing to disclose. R.D. has received grants and personal fees from Regeneron Pharmaceuticals, Inc., Sanofi, and Amgen; grants from Pfizer and Novartis; and personal fees from Valeant. D.B. has received grants for conducting clinical trials from Sanofi-Aventis and Regeneron Pharmaceuticals, Inc., Novartis, Eli Lilly, Amgen, and Aegerion; honoraria for lectures from Sanofi-Aventis and Regeneron Pharmaceuticals, Inc., Aegerion, Amgen, AstraZeneca, MSD, Pfizer, Servier, and Unilever; advisory board fees from Sanofi-Aventis, Aegerion, Amgen, AstraZeneca, and MSD; travel assistance from Amgen and Aegerion; fee for chairing steering committee from Aegerion; consultancy fee from Gemphire; and non-financial support (editorial assistance and statistical analysis) from Sanofi-Aventis and Regeneron Pharmaceuticals, Inc. F.C. received a research grant from his institution; personal fees from Sanofi, Lilly, Synageva, Pfizer, and Amgen; and grants and personal fees from Merck. M.K. has received grants and personal fees from Sanofi and Regeneron Pharmaceuticals, Inc., Amgen, and MSD and personal fees from AstraZeneca and Novartis. C.L. and M.T.B.-D. are employees of Sanofi and hold stock options in Sanofi. D.A.G., M.J.G., and R.P. are employees of, and stockholders in, Regeneron Pharmaceuticals, Inc. J.Z. is a contractor with Regeneron Pharmaceuticals, Inc. M.F. has received grants from Amgen, Merck, and Sanofi and consulting fees for Abbott, Eli Lilly, Pfizer, AstraZeneca, Roche, Kowa, and Recordati.
Acknowledgements
We thank the study patients and investigators and the following persons from the sponsors for their contributions to data collection and analysis, assistance with statistical analysis, or critical review of the manuscript: Regeneron Pharmaceuticals, Inc.: William J. Sasiela, PhD; Michael J. Louie, MD, MPH, MSc; and Carol Hudson, BPharm; Sanofi: Jay Edelberg, MD, PhD; L. Veronica Lee, MD; Guillaume Lecorps, MSc; and Michael Howard, MBA. Medical writing support was provided by Rob Campbell, Prime Medica Ltd, Knutsford, Cheshire, UK, funded by Sanofi and Regeneron Pharmaceuticals, Inc.
References

