


Abstract
The present study aims to compare the change of left ventricular deformation during dobutamine stress echocardiography (DSE) with the reference standard of invasive myocardial fractional flow reserve (FFR) to assess the haemodynamic significance of intermediate coronary lesions.
In 30 patients with an intermediate coronary artery stenosis in one epicardial coronary artery, FFR measurements were performed during coronary catheterization. In case of an FFR < 0.75 after intracoronary adenosine administration, the stenosis was considered significant, indicating ischaemia. In addition, during DSE, peak systolic strain rate and systolic strain of the region of interest (supplied by the stenotic vessel) and of a non-ischaemic remote region were assessed at baseline and at peak stress. Thirteen patients had an FFR ≥ 0.75, indicating normal flow reserve (non-ischaemic group). The remaining 17 patients with an FFR < 0.75 comprised the ischaemic group. At baseline DSE, mean values of strain rate (−1.2 ± 0.3 s−1) and strain (−17 ± 8%) were not significantly different between both groups. In the ischaemic group, in the target region, strain at peak stress decreased to − 10 ± 8%, whereas strain rate remained unchanged. In contrast, in the non-ischaemic group, strain at peak stress remained unchanged (−18 ± 7%), whereas strain rate increased to − 2.5 ± 1.1 s−1. The receiver operating characteristic curve analysis revealed the change in strain rate as the best parameter to detect ischaemia, with a sensitivity of 89% and a specificity of 86%. In the remote region, in both groups, strain rate (−1.4 ± 0.4 s−1) and strain values (−20 ± 7%) were not significantly different at baseline, and strain rate doubled and strain remained unchanged at DSE peak stress.
Non-invasive evaluation of regional deformation, using strain rate imaging during DSE, predicted the relevance of intermediate coronary stenosis. In this context, strain rate is superior to strain measurements for the quantification of the contractile reserve.
Introduction
In patients with coronary artery disease, evaluation of the functional significance of intermediate coronary lesions remains a diagnostic challenge.1 On the basis of pressure-derived analysis of the coronary stenoses during maximal coronary dilation, the concept of myocardial fractional flow reserve (FFR) has been developed as an invasively determined index of the functional severity of coronary stenosis.2,3 This index is widely accepted as the gold standard for the assessment of intermediate coronary lesions.4
On the basis of the coupling between coronary flow and myocardial function, dobutamine stress echocardiography (DSE) is clinically used for the visual detection of inducible ischaemia and, thus, to evaluate the functional significance of coronary lesions.5,6 However, reading DSE is subjective and strongly dependent on experience, making more objective echocardiographic markers desirable.7–9
Ultrasonic strain rate imaging is a reliable technique for the quantitative assessment of the amount of regional myocardial deformation (strain) and for the velocity of deformation (strain rate). It has been validated in a correlative experimental sonomicrometric study10 and used in a series of experimental and clinical studies.11–17 Recent reports confirm that strain rate imaging can be used as an objective technique during DSE in patients with significant coronary stenoses.14,18
Thus, the aim of this clinical study is to investigate the regional myocardial deformation during DSE in patients with intermediate coronary lesions and to compare these non-invasive functional measurements with the invasively assessed myocardial FFR. We hypothesized that by the use of strain rate imaging during DSE, pathological and normal flow reserve can be differentiated.
Methods
Study protocol
The study population comprised 30 consecutive patients with one intermediate stenosis in a large coronary artery (and no concomitant severe coronary artery stenoses) as determined during elective heart catheterizations. In all patients, the visual assessment of the intermediate stenosis and the reported clinical symptoms was regarded not sufficient to justify the ad hoc coronary intervention. For this group of patients, coronary pressure measurements are routinely performed during a second heart catheterization at our institution to assess the functional severity of the intermediate coronary stenosis. For the present study, patients with more than mild valvular heart disease, severe left ventricular (LV) hypertrophy, small target arteries, or acute coronary heart syndrome were not eligible. Patients with stenoses in other coronary vessels or patients with former coronary angioplasty were admitted to the study if the stenosis was < 50% and not in the target region. After stopping medication with β-blockade for at least 48 h, stress echocardiography in combination with strain rate imaging during dobutamine stimulation was performed in all patients. No ECG was recorded during the stress echocardiography. Within the following 3 days, coronary angiography with intracoronary pressure measurements and the calculation of FFR was done in all patients (none of the 30 patients refused). If FFR was < 0.75 (a value which was established on the basis of previous validation studies2,3), percutaneous transluminal coronary angioplasty and stent implantation were performed. The investigation conformed to the principles outlined in the Declaration of Helsinki and informed consent was obtained from all patients.
Coronary angiography and pressure measurements
Quantitative analysis of the stenoses was carried out by a computer-based edge-detection method (QCA, Pie Medical, Rotterdam, the Netherlands). To account for variable coronary anatomy, a blinded reader experienced in both coronary angiography and echocardiography assigned myocardial segments to the presumed perfusion territories of the stenosed vessel. In general, the left anterior descending artery was considered to supply anterior, anteroseptal, and mid and apical septal segments, the circumflex artery to supply the lateral wall, and the right coronary artery to supply the basal septal and inferior segments. The anatomy of the coronary artery and the LV segments was merged by an experienced cardiologist for invasive and non-invasive cardiology. Thus, the potential ischaemic region was termed ‘target region’, and a ‘remote region’ was defined in the opposite LV wall (supplied by a non-stenotic coronary artery).
Coronary pressure measurements were performed with a 0.014 in. pressure wire (RADI, Uppsala, Sweden) via a 6 Fr guiding catheter. The wire was passed through the target lesion with the tip > 3 cm distal to the stenoses. Both aortic and distal coronary pressure were measured at rest and at maximum hyperaemia induced by intracoronary bolus injection of up to 120 µg adenosine. FFR was calculated as the ratio of mean distal coronary pressure measured via the pressure wire to the mean aortic pressure measured via the tip of the guiding catheter. The measurements were performed twice, and FFR was reported as the average of both measurements. Values for myocardial flow reserve < 0.75 were considered functionally significant and these patients were termed as ischaemic group. The remaining patients with an FFR ≥ 0.75 were termed as non-ischaemic group. Patients with an FFR < 0.75 underwent coronary intervention according to the standard guidelines.
Dobutamine stress protocol
After baseline data acquisition, patients underwent a standard DSE protocol with incremental dobutamine infusion rates of 10, 20, 30, and 40 µg/kg/min for 3 min each and up to 2 mg of atropine if necessary. The endpoints for dobutamine infusion were 85% of maximal heart rate, systolic blood pressure increase to > 240 mmHg or decrease to < 100 mmHg, development or deterioration of wall motion abnormalities, severe chest pain, severe arrhythmias, intolerable side effects. To optimize endocardial delineation, a contrast agent (SonoVue®, Bracco Diagnostics Inc, Princeton, NJ, USA) was administered at baseline and peak stress. As the tissue Doppler imaging data were acquired just before using the contrast agent, there was no loss in tissue Doppler data quality.
Echocardiographic image acquisition
Transthoracic echocardiography was performed using a VIVID Five ultrasound scanner (GE Ultrasound®, Horten, Norway). Before starting the stress protocol, a baseline standard echocardiographic study for the evaluation of LV and left atrial dimension, LV wall thickness, LV ejection fraction, and potential valvular heart disease was done. At baseline and at each step of the DSE, three heart cycles of the apical four-, three-, and two-chamber view were acquired in conventional two-dimensional B-mode. In addition, using the same apical views, three heart cycles in the tissue Doppler imaging mode were captured at baseline and at peak DSE. For tissue Doppler imaging, the image sector was set as narrow as possible, resulting in a frame rate of more than 140 frames per second. Echocardiographic data were stored digitally for subsequent offline analysis.
Echocardiographic visual assessment of wall motion
Conventional two-dimensional loops were read by an experienced reader using a quad screen format with synchronized display of baseline, low-dose, peak-dose, and recovery stages. Inducible ischaemia was defined as reduction or deterioration of systolic wall thickening in less than or equal to one segment or appearance of new or worsening of existing wall motion abnormalities during the stress protocol. The reader was blinded for the quantitative coronary angiography and FFR results, but was aware of the location of the stenosis and, thus, the target region.
Strain rate imaging

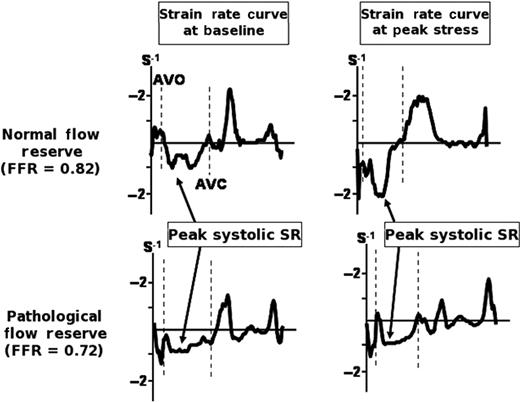
A typical example of the strain rate curves in a patient with normal flow reserve (non-ischaemic group) and in a patient with pathological flow reserve (ischaemic group). Note that the peak systolic strain rate only increases during DSE peak stress in the patient with normal flow reserve. AVC, aortic valve closure; AVO, aortic valve opening; DSE, dobutamine stress echocardiography; FFR, fractional flow reserve; SR, strain rate.
All parameters were extracted for the segments of the ‘target region’ (on average 2.5 ± 1.5 segments per patient) and the ‘remote region’ (on average 2.2 ± 1.1 segments per patient). The intra-observer variability (expressed in percentage of the mean) for this method was recently published and averaged 10% for SR and 11% for ε.19
Data analysis
Differences between the target and remote region within subjects were tested using a non-parametric test for paired samples (Wilcoxon signed-rank test). Comparisons between different groups were tested using the t-test for unpaired samples after testing for equality of variances by Levene's test. Categorical variables were compared using Fisher's exact test. The change (i.e. the difference) during DSE in parameters describing regional myocardial deformation and heart rate between baseline and peak stress measurements was compared using ANOVA, with adjustment for the respective baseline value, followed by Scheffe's post hoc test. Diagnostic test characteristics were computed and reported with their respective 95% confidence intervals (CI). Receiver operating characteristics (ROC) were used for the detection of pathological flow reserve defined as FFR < 0.75 (i.e. ischaemic response). ROC curves were compared taking into account the correlation between models, as they were based on the same cases.19
Sample size considerations
Given the clinical situation of an intermediate coronary stenosis, we assumed a pre-test probability of 0.50. In other diagnostic studies (using a different methodology as echocardiographic wall motion scoring, myocardial scintigraphy, or positron emission scintigraphy), the reported test characteristics varied between 0.60 and 0.85 for specificity and 0.50 and 0.75 for the positive predictive value. For the present study, we aimed at a positive predictive value (i.e. the post-test likelihood of a positive test result) of 0.85. This corresponds to a positive likelihood ratio of 5.5 and to values for specificity and sensitivity of 0.85 each. These test characteristics may be achieved by a test which results in two false-positives and two false-negatives in a sample of 2 × 13 patients, using a cut-off value for strain rate derived from the respective ROC curve. The primary analysis focused on the clinical utility of strain rate. All other analyses are considered secondary. Thus, no adjustment of α was applied. All tests were performed two-sided. A P-value < 0.05 was considered to indicate statistical significance.
Results
All 30 patients completed the entire study protocol and were included in the final data set. According to the FFR measurements, the patients were divided into two groups: ischaemic (FFR < 0.75; n = 17) and non-ischaemic (FFR ≥ 0.75, n = 13). In the ischaemic group, four patients showed the stenosis in the circumflex artery, six in the right coronary artery, and seven in the left anterior descending artery. In the non-ischaemic group, four patients showed the stenosis in the circumflex artery, four in the right coronary artery, and five in the left anterior descending artery. An example of the FFR measurement in a patient with an ischaemic and in a patient with a non-ischaemic response is given in Figures 2 and 3. The FFR at maximum hyperaemia averaged 0.84 ± 0.06 in the non-ischaemic group and 0.68 ± 0.05 in the ischaemic group (P < 0.0001). In both groups, age, NYHA class, blood pressure, and coronary risk factors were equally distributed. The baseline characteristics of the two groups are summarized in Tables 1 and 2. The DSE baseline heart rate was similar in both groups (non-ischaemic 71 ± 11 min−1; ischaemic 74 ± 19 min−1; P = 0.84) and increased significantly at peak stress in both groups (non-ischaemic 134 ± 26 min−1; ischaemic 132 ± 18 min−1). During DSE, three patients of the non-ischaemic group (23%; atypical angina pectoris probably attributable to sensations induced by the dobutamine infusion) and 11 patients of the ischaemic group (64%) complained about angina pectoris. No adverse event occurred during DSE. The results of the angiographic data show no difference between both groups and are given in Table 2.
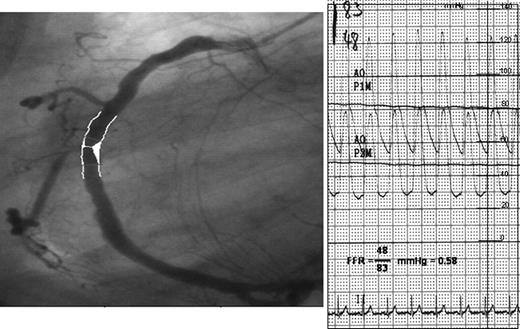
Angiography (left panel) and aortic plus distal coronary pressure (right panel) at maximum hyperaemia induced by intracoronary bolus injection of adenosine in an ischaemic patient. In addition, the calculated fractional flow reserve (0.58) is given.
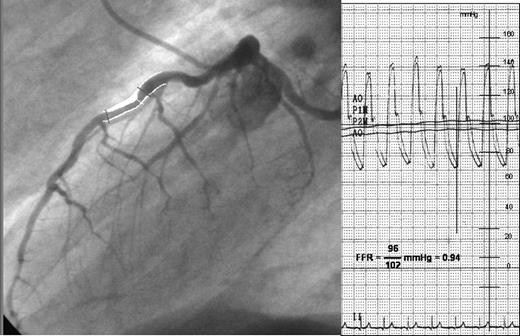
Angiography (left panel) and aortic plus distal coronary pressure (right panel) at maximum hyperaemia induced by intracoronary bolus injection of adenosine in a non-ischaemic patient. In addition, the calculated fractional flow reserve (0.94) is given.
Baseline characteristics of the two patient groups
| Non-ischaemic group (n = 13) | Ischaemic group (n = 17) | P-value | |
|---|---|---|---|
| Age (years) | 60 ± 11 | 62 ± 8 | 0.25 |
| Height (m) | 174 ± 8 | 172 ± 7 | 0.28 |
| Weight (kg) | 84 ± 16 | 81 ± 13 | 0.29 |
| NYHA class | 2.3 ± 0.5 | 1.9 ± 0.7 | 0.26 |
| Hypertension | 11 (85) | 15 (88) | 0.62 |
| Diabetes mellitus | 3 (23) | 2 (12) | 0.12 |
| Hypercholesterolaemia | 10 (77) | 14 (84) | 0.51 |
| Smoking | 4 (31) | 7 (41) | 0.48 |
| Family history of CAD | 4 (31) | 6 (35) | 0.41 |
| RR systolic (mmHg) | 134 ± 18 | 135 ± 20 | 0.77 |
| RR diastolic (mmHg) | 71 ± 10 | 71 ± 12 | 0.99 |
CAD, coronary artery disease; RR, blood pressure; t-test for unpaired samples/χ-quadrat Fisher's exact test; values are mean ± SD or n(%).
Coronary angiography and pressure measurements
| Non-ischaemic group (n = 13) | Ischaemic group (n = 17) | P-value | |
|---|---|---|---|
| Degree of stenosis (%) | 50 ± 9 | 57 ± 12 | 0.48 |
| One-vessel disease | 7 | 5 | 0.25 |
| Two-vessel diseasea | 3 | 9 | 0.11 |
| Three-vessel diseasea | 3 | 4 | 0.42 |
| FFR rest | 0.92 ± 0.04 | 0.85 ± 0.09 | 0.52 |
| FFR stress | 0.84 ± 0.06 | 0.69 ± 0.05* | <0.0001 |
FFR, fractional flow reserve.
Values are mean ± SD or n; t-test for unpaired samples/Fisher's exact test.
aWhenever the patient had already one or more coronary intervention in different vessels in the past, it was called two- or three-vessel disease.
*P < 0.05 vs. non-ischaemic group.
Echocardiographic standard measurements
LV and left atrial dimensions were within normal range and not significantly different between both groups (Table 3). No patient in either group had LV hypertrophy. The wall thickness of the inferolateral wall averaged 7.0 ± 0.9 mm in the non-ischaemic group and 7.4 ± 1.4 mm in the ischaemic group (P = 0.47). In addition, LV ejection fraction was within normal range at baseline (non-ischaemic group 62 ± 12%; ischaemic group 57 ± 14%; P = 0.36) and increased slightly at peak DSE. All standard echocardiographic measurements are given in Table 3.
Standard echocardiography and dobutamine stress echocardiography
| Non-ischaemic group (n = 13) | Ischaemic group (n = 17) | P-value | |
|---|---|---|---|
| Baseline measurement | |||
| Ejection fraction (%) | 62 ± 12 | 57 ± 14 | 0.43 |
| LVEDD (mm) | 54 ± 8 | 54 ± 6 | 0.78 |
| LVESD (mm) | 46 ± 9 | 44 ± 9 | 0.12 |
| LA diameter | 38 ± 5 | 38 ± 6 | 0.95 |
| ED inferolateral wall thickness | 7.0 ± 0.9 | 7.4 ± 1.4 | 0.48 |
| ED septal wall thickness | 8.1 ± 0.9 | 8.6 ± 1.9 | 0.47 |
| Peak stress measurement | |||
| Ejection fraction (%) | 71 ± 7 | 65 ± 13 | 0.12 |
| LVEDD (mm) | 50 ± 10 | 49 ± 9 | 0.38 |
| LVESD (mm) | 39 ± 11 | 39 ± 12 | 0.74 |
ED, end-diastolic; LA, left atrial; LVEDD, left ventricular end-diastolic diameter; LVESD, left ventricular end-systolic diameter. Values are mean ± SD; t-test for unpaired samples.
Echocardiographic visual assessment of wall motion
Visual wall motion assessment was possible in all segments. Using FFR as the gold standard, 12 out of the 17 ischaemic and 10 out of the 13 non-ischaemic patients were correctly classified by conventional visual assessment (a sensitivity of 80% and a specificity of 67% to detect the ischaemic myocardium; Table 4).
Statistics for strain rate and wall motion scoring
| Strain rate value % (95% CI) | Wall motion scoring value (95% CI) | |
|---|---|---|
| Sensitivity | 0.89 (0.79–0.99) | 0.80 (0.6–1.0) |
| Specificity | 0.89 (0.78–1.0) | 0.67 (0.43–0.91) |
| Positive predictive value | 0.91 (0.82–1.0) | 0.71 (0.49–0.92) |
| Negative predictive value | 0.86 (0.74–0.99) | 0.77 (0.54–1.0) |
Strain rate imaging at the target region
The absolute values at baseline and at peak DSE stress are calculated and compared for the individual corresponding segments. At DSE baseline, peak systolic strain rate as a parameter for the deformation velocity in the target region was not significantly different between both groups and averaged − 1.2 ± 0.3 s−1 in the non-ischaemic group and − 1.3 ± 0.4 s−1 in the ischaemic group (P = 0.19). In parallel, the amount of systolic shortening (i.e. systolic strain) and the amount of ongoing shortening after aortic valve closure (i.e. post-systolic strain) were not significantly different between the two groups (εSYS: non-ischaemic − 18.7 ± 7.5%, ischaemic − 15.3 ± 9.0%; P = 0.10; εPSS: non-ischaemic − 1.0 ± 0.9%, ischaemic − 1.4 ± 1.5%; P = 0.11). At peak stress, systolic strain rate increased only in the non-ischaemic group (SR = − 2.5 ± 1.1 s−1 vs. baseline DSE, P < 0.0001) but not in the ischaemic group (SR = − 1.3 ± 0.9 s−1 vs. baseline DSE, P = 0.81). In contrast, εSYS remained unchanged in the non-ischaemic group (εSYS = − 17.5 ± 7.8%, P = 0.43) and decreased in the ischaemic group (εSYS = − 10.4 ± 8.9%, P = 0.001). In addition, there was a significantly higher increase in εPSS in the ischaemic group (εPSS = − 4.9 ± 4%, vs. baseline DSE P < 0.0001) compared with the non-ischaemic group (εPSS = − 2.6 ± 3.0%, vs. baseline DSE P = 0.008). The change of these values from baseline to peak stress DSE is displayed in Figure 4. Furthermore, ROC analysis was done for the peak stress values of systolic strain rate, εSYS, εPSS, and the ratio of εPSS/maximal strain, and also for the change of these parameters between baseline and peak stress. The ROC curves demonstrated that the change of systolic strain rate was the best parameter for the detection of pathological flow reserve. According to this ROC analysis, an increase of peak systolic strain rate of < 0.6 s−1 indicated the ischaemic response with a sensitivity of 89% and a specificity of 89% (accuracy 89%; Figure 5 and Table 4).
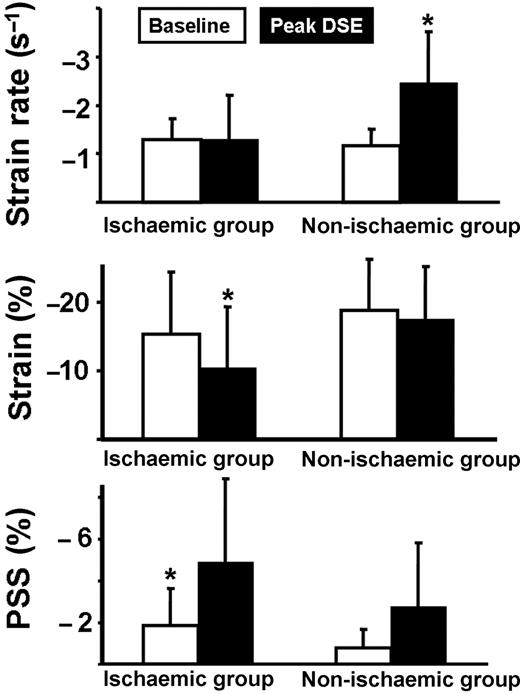
Results for peak systolic strain rate, systolic strain, and post-systolic strain in the ischaemic group and in the non-ischaemic group. Data are given at baseline and at peak dobutamine stress echocardiography. PSS, post-systolic strain. *P < 0.001 vs. baseline values.
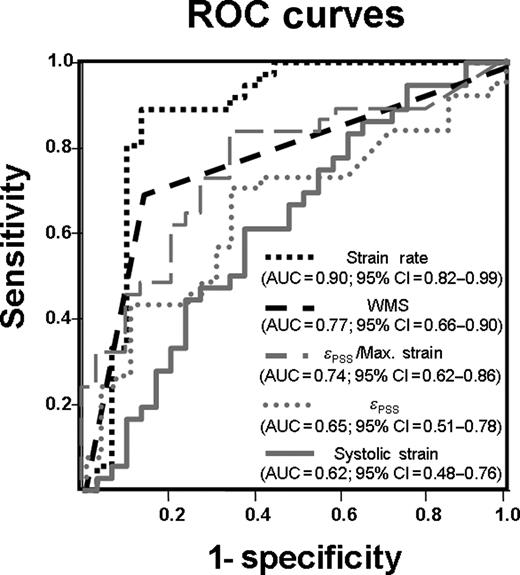
Receiver operating characteristic curves for the detection of pathological flow reserve (ischaemic response; FFR < 0.75). The area under the curve with its 95% CI is given for the different parameters. Strain rate vs. strain: P < 0.05; Strain rate vs. WMS: P < 0.10. AUC, area under the curve; εPSS, post-systolic strain; εPSS/Max. strain, ratio of post-systolic strain to maximal strain; Strain rate, change of strain rate between baseline and stress; WMS, wall motion scoring.
Strain rate imaging in the remote region
In the remote region, SR, εSYS, and εPSS were equal in both groups at baseline and not significantly different compared with the target region (non-ischaemic group: SR = − 1.4 ± 0.4 s−1, P = 0.22; εSYS = − 21.7 ± 8.7%, P = 0.21; εPSS = − 1.4 ± 1.9%, P = 0.13; ischaemic group: SR = − 1.3 ± 0.4 s−1, P = 0.86; εSYS = − 18.0 ± 6.9%, P = 0.14; εPSS = − 1.0 ± 1.5%, P = 0.36). At peak stress, SR increased significantly in both groups (non-ischaemic − 2.7 ± 0.9 s−1, P < 0.0001; ischaemic − 2.6 ± 0.7 s−1, P < 0.0001; P = 0.28 for comparison between groups) and was not different compared with the target region of the non-ischaemic group (−2.5 ± 1.1 s−1, P = 0.20). In addition, εSYS remained stable in both groups (non-ischaemic group − 20.6 ± 7.3%, P = 0.41; ischaemic group − 19.2 ± 5.7%, P = 0.12; P = 0.20 for comparison between groups), whereas εPSS increased slightly (non-ischaemic group − 2.9 ± 3.5%, P = 0.16; ischaemic group − 2.6 ± 2.9%, P = 0.41; P = 0.10 for comparison between groups).
Discussion
This clinical pilot study investigated the regional contractile reserve in patients with intermediate coronary lesions. The invasive measurement of myocardial FFR was used as the reference standard for the assessment of the functional severity of coronary stenoses. It shows that pathological and normal flow reserve can be differentiated by the use of strain rate imaging during DSE.
Intermediate coronary stenosis
In patients with coronary stenosis, especially in those with intermediate lesions, the decision to perform revascularization procedures should be based not only on the coronary anatomy but also on the functional severity of a lesion.3 FFR reliably identifies functionally significant stenoses, taking into account both antegrade and collateral flow contributions to maximal myocardial perfusion.3,4 Thus, FFR was used as the gold standard for the evaluation of the functional severity of the examined lesion in this study. A normal FFR (>0.75) at rest indicated sufficient blood flow to the region of interest. This could be documented by normal strain rate and strain values in the myocardial region of interest, which were not significantly different to the non-affected remote region. In patients with a normal FFR (i.e. non-ischaemic group), adequate blood flow to the supplied region of interest resulted in an increase of strain rate by 105% during dobutamine stress, which is in good accordance with experimental and clinical studies.14,17,20 Further, this increase during dobutamine stress was of equal magnitude compared with the increase in strain rate in the non-affected remote region. In contrast, in patients with haemodynamic significant stenoses, as documented by an FFR < 0.75, the pathological flow reserve during DSE resulted in an unchanged strain rate at peak stress, i.e. a blunted response. Thus, in ischaemic segments, the inotropic challenge with dobutamine failed to stimulate the velocity of myocardial deformation (strain rate). The current data demonstrated that during DSE, pathological and normal flow reserve may be better differentiated using the change of strain rate rather than the change in strain values. This is in accordance with experimental and clinical data, showing that strain rate but not strain values are related to regional contractility independent of heart rate.15,20 In addition, it was demonstrated in a clinical study that strain rate correlates with FFR.17 In previous studies with significant stenoses, it was suggested that the typical ischaemic response is characterized by an increase in post-systolic strain associated with a reduction of systolic strain.14,21 In the current study, we confirmed the same shift of deformation to post-systole during ischaemia. However, in patients with intermediate stenoses, the change in strain rate seems to be superior for the detection of subclinical ischaemia. Thus, in intermediate lesions, after invasive (by the use of FFR) and also non-invasive (by the use of strain rate) assessment of the haemodynamic significance, PCI is appropriate and should be performed.
Clinical implications
In interventional cardiology, patients undergoing PCI without objective evidence of ischaemia are a matter of concern and debate.22 Since the prevalence of coronary artery stenosis in an asymptomatic average population of men aged 60 years is 20%,23 angiographically detected coronary lesions are a frequent coincidental finding, and PCI may, thus, be performed unnecessarily in many cases. The identification of the haemodynamic relevance of a coronary lesion is an issue of growing importance because the number of elderly patients presenting with coronary artery disease is increasing. Thus, a non-invasive, cheap, widely available, and robust technique will be of clinical importance. Strain rate imaging offers a number of advantages in this respect.
With the new generation of echocardiography scanners, it is possible to acquire tissue Doppler data instantaneously with two-dimensional grey scale loops during DSE without losing image quality. Although the analysis of a complete research data set is time consuming, it is possible to analyse the region of interest within 1 min. Using strain rate imaging tools, patients at baseline serve as their own control. According to our ROC analysis, in this highly selected group of patients, an increase of peak systolic strain rate of < 0.6 s−1 indicates the functional significance of the examined stenosis with a sensitivity of 89% and a specificity of 89%. As this approach is rather based on the change of strain rate within the interrogated myocardium, the potential error in measurement of absolute values (i.e. angle dependency) becomes less important. However, in general, the angle between the ultrasound beam and the deformation in the region of interest should not be > 20°.
Limitations
The investigated patients were highly selected, as patients with abnormal loading conditions (i.e. valvular heart disease), multiple significant coronary stenosis, or acute coronary heart syndrome were excluded. Both the change in loading conditions10 and acute ischaemia13,21 may impact on the regional myocardial deformation and, thus, affect the clinical interpretation of the resulting haemodynamic changes during DSE. However, the purpose of this study was to assess the clinical utility of strain rate imaging in stable patients with one intermediate stenosis. Another limitation is the fact that in a few patients, the remote region was supplied by vessel in which an intervention might have been performed in the past (but without significant stenosis at the time of the current study). Significantly, more patients with diabetes mellitus were included in the non-ischaemic group, which might have impacted on FFR measurements owing to abnormal microcirculation. In addition, abnormal microcirculation can also be present in the remote region, which also may impact on regional deformation. However, the potential abnormal microcirculation could not be assessed in this clinical protocol. Another limitation is that strain rate imaging was not performed at intermediate dobutamine doses.
Conclusions
The increase in peak systolic strain rate during stress discriminated best between lesions associated with inducible ischaemia and lesions without haemodynamic significance. Therefore, strain rate imaging may prove useful to non-invasively assess the functional relevance of an intermediate epicardial coronary stenosis.
Conflict of interest: none declared.
References
Author notes
The first two authors contributed equally to this study.

