


Abstract
The aim of the present study was to compare the prognostic value of a novel and promising marker, copeptin, with B-type natriuretic peptide (BNP), and N-terminal pro-BNP (NT-proBNP), on death or a composite cardiovascular endpoint in patients who developed heart failure after an acute myocardial infarction (AMI).
From a subset of 224 patients of the OPTIMAAL study, blood samples were drawn at a mean of 3 days after AMI when all patients had signs and/or symptoms of heart failure or a left ventricular ejection fraction <0.35. Endpoints of interest were mortality (primary endpoint of OPTIMAAL) and a composite cardiovascular endpoint, including death, MI, stroke, and/or resuscitated cardiac arrest. Mean age was 67 ± 10 years, and mean follow-up was 33 ± 7 months. Using univariable Cox proportional hazards survival analysis, higher levels of copeptin, BNP, and NT-proBNP were all significantly related to both mortality and the composite cardiovascular endpoint (all P < 0.01). In a multivariable Cox proportional hazards model, including all three biomarkers and other relevant covariates, a doubling of copeptin was related to a 1.83 (1.26–2.64) times increased risk of mortality (P < 0.0001) and a 1.35 (1.05–1.72) times increased risk of the composite cardiovascular endpoint (P = 0.018). Receiver operating characteristic curves indicated that copeptin [area under curve (AUC) 0.81] was a stronger predictor of mortality compared with both BNP (AUC 0.66; P = 0.0063 vs. copeptin) and NT-proBNP (AUC 0.67; P = 0.0016 vs. copeptin). Finally, changes of copeptin levels after 1 month significantly added prognostic information to the baseline value.
Copeptin is a strong and novel marker for mortality and morbidity in patients with heart failure after AMI. In this population, the predictive value of copeptin was even stronger than BNP and NT-proBNP.
Introduction
Chronic heart failure is a complex clinical syndrome, characterized by the activation of several neurohormones. Various neurohormones have been used as biomarkers for the diagnosis, prognosis, and for clinical decision making in chronic heart failure. In particular, B-type natriuretic peptide (BNP) and N-terminal pro-BNP (NT-proBNP) are strong prognostic markers.1 A potential disadvantage is that BNP and NT-proBNP in patients with heart failure are strongly related to age2 and renal function,3 which in themselves carry prognostic value. In addition, variations of plasma BNP values in chronic heart failure patients over time are large.4
Besides natriuretic peptides, several other neurohormones are elevated in patients with heart failure. One such peptide is arginine vasopressin (AVP), also known as anti-diuretic hormone, which is released from the hypothalamus in response to changes in plasma osmolality and arterial hypovolaemia. In general, AVP plasma values are increased in patients with chronic heart failure and related to the severity of the disease.5 Arginine vasopressin is however unstable, which makes it unsuitable to use as a biomarker in chronic heart failure. In contrast, the C-terminal portion of provasopressin (copeptin) is very stable and can be easily measured, making it potentially suitable as a biomarker in CHF. It was recently demonstrated that copeptin was a strong prognostic marker for prognosis in patients after an acute myocardial infarction (AMI),6 in patients with chronic heart failure,7,8 and in patients with acute destabilized heart failure.9
The current study was performed to investigate the prognostic value of copeptin on mortality and morbidity in patients with heart failure after an AMI, and to compare its prognostic value with both BNP and NT-proBNP. In addition, we studied the additive prognostic value of changes of copeptin over time.
Methods
Patients and methods
The OPTIMAAL (Optimal Trial in Myocardial Infarction with Angiotensin II Antagonist Losartan) trial was a randomized, double-blind trial, comparing the effect of the angiotensin-converting enzyme-inhibitor captopril (50 mg three times daily) and the angiotensin receptor antagonist losartan (50 mg daily) on all-cause mortality in patients over 50 years of age with an AMI and signs or symptoms of heart failure.10 Signs or symptoms of heart failure during the acute phase were defined as one or more of the following: treatment with diuretic or intravenous vasodilator therapy for heart failure, pulmonary rales, third heart sound, persistent sinus tachycardia (100 b.p.m.), or radiographic evidence of pulmonary congestion. Patients with an AMI and an ejection fraction of <35% or a left-ventricular end-diastolic dimension of >65 mm (optional) and/or a new Q-wave anterior-wall AMI, or any re-infarction with previous pathological Q-waves in the anterior wall were also eligible. Patients were enrolled within 10 days of onset of symptoms.10 Primary endpoint was all-cause mortality. The background, rationale, and results were previously described.11 A total of 5477 were included in OPTIMAAL. The present study is based on the data from a pre-specified neurohormonal substudy, including 224 patients from six participating centres. These six centres were all centres from Norway that were willing to participate in this substudy. Except for their willingness to participate, there was no other selection bias. In addition, the baseline characteristics of patients showed no significant differences between the OPTIMAAL main trial and this substudy.
The trial was analysed by intention to treat; clinical endpoints were captured for all randomized patients until death or the end of study. All deaths were adjudicated as to cause and were included in the analysis of the primary endpoint; only adjudicated endpoints were used in the analyses of re-infarctions and strokes. Safety analyses included all randomized patients from the time of randomization throughout the trial, or permanent discontinuation of study medication, whichever came first.
Blood sampling
Blood samples were obtained at baseline (median 3 days post-MI), and at 30 days and 1 year of follow-up. The trial protocol was approved by the local Ethics Committees and done in accordance with the Declaration of Helsinki.
Blood samples were collected using pyrogen-free tubes containing EDTA (Becton Dickinson, San Jose, CA, USA) and immediately centrifuged at 3000 r.p.m. for 30 min at 4°C. The platelet poor plasma was separated and stored at −80°C until analysis. The estimated glomerular filtration rate (eGFR) was calculated using the abbreviated modification of diet in renal disease (MDRD) equation: 186 × (Creat/88.4) − 1.154 × Age − 0.203 (×0.742 if female).
Copeptin assay
Copeptin was detected with a novel commercial chemiluminescence assay (B.R.A.H.M.S. Aktiengesellschaft, Hennigsdorf/Berlin, Germany) as described previously.12 Briefly, a polyclonal antibody against a peptide representing amino acids 132–147 of preproAVP was used as solid-phase antibody, and a polyclonal antibody raised against a peptide representing amino acids 149–164 of preproAVP was used as a tracer. Dilutions of a peptide representing amino acids 132–164 of preproAVP in normal horse serum served as standards. The analytical detection limit of the assay was 1.7 pmol/L, and the interlaboratory CV was <20% for values >2.25 pmol/L and <10% for values >9 pmol/L.
B-type natriuretic peptide and N-terminal-pro-B-type natriuretic peptide assays
Both assays were carried out in the laboratory of the Pharmacology and Therapeutics Group, Department of Cardiovascular Sciences, University of Leicester, using non-commercial assays. The NT-proBNP assay has been described previously.13 Briefly, we used a non-competitive assay for NT-proBNP using unextracted plasma, with the capture antibody directed to the C-terminal of human NT-proBNP and the biotinylated N-terminal-directed antibody as the detector antibody. Aliquots (10–20 µL) of samples or N-BNP standards were incubated in the C-terminal antibody-coated enzyme-linked immunosorbent assay (ELISA) plate wells together with 100 µL of the biotinylated N-terminal antibody for 24 h at 4°C. Detection was with streptavidin (Chemicon International Ltd, Harrow, UK) labelled with methyl-acridinium ester (5 × 10⁶ relative light units/mL) added to each well. Plates were then read on a Dynatech MLX Luminometer (Dynex Technologies Ltd, Worthington, UK), with sequential injections of 100 µL of 0.1 M nitric acid (with H2O2) and then 100 µL of NaOH (with cetyl ammonium bromide). The lower limit of detection was 14.4 fmol/mL of plasma and there was no significant cross-reactivity with NT-ANP, BNP, or CNP.
The assays for BNP were based on commercially available antibodies (Phoenix Pharmaceuticals Inc., Belmont, CA, USA). In brief, BNP was measured on C18 extracts of plasma, dried on a centrifugal evaporator, and then reconstituted in assay buffer.14 Antibodies were from Bachem UK Ltd (St Helens, Meyerside, UK), and samples or standards were pre-incubated with 25–50 ng of the specific antibodies (within ELISA plate wells coated with 500 ng of anti-rabbit immunoglobulin G). All peptide tracers were produced by biotinylation with biotin-X-N-hydroxysuccinimide ester (Calbiochem, Nottingham, UK), followed by purification using reverse-phase high-performance liquid chromatography on a C18 column, developed with an acetonitrile gradient (2% per minute). After 24 h of incubation at 4°C, biotinylated tracers of the peptides were added to each well. After a further 24 h of incubation at 4°C, ELISA plates were washed, treated with streptavidin labelled with methyl-acridinium ester, and followed by detection of enhanced chemiluminescence as discussed previously. Each assay was confirmed not to cross-react with the other natriuretic peptides while maintaining 100% specificity for BNP.
Statistical analyses
Results are presented as mean ± standard deviation (normal distribution) or median ± inter-quartile range (IQR; non-normal distribution). Comparison of continuous variables between groups was made by unpaired Student’s t-test, and, if non-normally distributed, by Mann–Whitney U test. Analysis of variance was used to compare differences in baseline clinical characteristics among quartiles of copeptin. Univariable Cox regression analysis was performed to establish the prognostic value of all variables presented in Table 1 on the two major endpoints. The first major endpoint was total mortality and the second major endpoint was the composite endpoint of death, MI, stroke, and/or resuscitated cardiac arrest. Multivariable models were made using an epidemiological approach, entering well-known predictors for outcome (age, gender, renal function, previous MI, diabetes, and treatment group) in a multivariable Cox proportional hazard model. We made three multivariable models, one adding copeptin to these predictors, one adding BNP, and one adding NT-proBNP. B-type natriuretic peptide, NT-proBNP, and copeptin showed a log-linear functional shape with the response variable and was transformed to a 2-log scale. This means that risk estimates should be interpreted as the relative risk if values of NT-proBNP were doubled (e.g. 10 to 20 pg/mL). The assumption of proportional hazards was assessed by graphing the log-minus-log. Kaplan–Meier plots were used to illustrate survival probability over time. Receiver operating characteristic (ROC) curves were computed to assess the ability of copeptin, BNP, and NT-proBNP to predict both endpoints. The areas under the ROC curves were calculated and compared statistically using Stata’s roctab and roccomp commands, respectively. The roccomp command compares the areas under two or more ROC curves using a non-parametric algorithm based on the χ2 distribution.15 Since follow-up of the survivors was very similar (minimum 31 months, maximum 40 months), we have limited the ROC analysis to an overall follow-up period of 31 months, allowing all survivors to be taken into the analysis.
Baseline characteristics of the subgroup of 224 patients from the OPTIMAAL study divided into quartiles of copeptin (pmol/L)
| Variable | Total (n = 224) | Copeptin <8.1 | Copeptin 8.2–13.7 | Copeptin 13.8–25.9 | Copeptin >25.9 | P-value for trend |
|---|---|---|---|---|---|---|
| Age [mean (±SD)] | 68 (10) | 63 (8) | 65 (10) | 71 (10) | 73 (11) | <0.0001 |
| Female [n (%)] | 67 (30) | 19 (36) | 10 (19) | 18 (33) | 17 (31) | 0.26 |
| BNP [median (IQR)] (pmol/L) | 109 (59–182) | 73 (47–113) | 102 (56–148) | 108 (58–163) | 169 (114–273) | <0.0001 |
| NT-proBNP [median (IQR)] (pmol/L) | 1223 (739–1981) | 836 (555–1229) | 1142 (783–1431) | 1299 (779–1890) | 2047 (1326–2392) | <0.0001 |
| BMI [mean (±SD)] | 26 (4) | 26 (4) | 27 (3) | 26 (4) | 25 (4) | 0.39 |
| Smokers [n (%)] | 89 (40) | 26 (49) | 18 (35) | 21 (39) | 19 (35) | 0.38 |
| Previous AMI [n (%)] | 26 (12) | 4 (8) | 3 (6) | 10 (19) | 7 (13) | 0.15 |
| Diabetes [n (%)] | 26 (12) | 5 (9) | 4 (8) | 8 (15) | 8 (15) | 0.57 |
| Hypertension [n (%)] | 72 (32) | 16 (30) | 15 (29) | 16 (30) | 18 (33) | 0.98 |
| Anterior AMI [n (%)] | 135 (60) | 39 (74) | 30 (58) | 29 (54) | 30 (55) | 0.13 |
| SBP [mean (±SD)] | 124 (17) | 125 (16) | 124 (17) | 125 (14) | 122 (21) | 0.71 |
| eGFR [mean (±SD)] (mL/min/1.73 m2) | 72 (17) | 78 (13) | 78 (12) | 75 (17) | 61 (18) | <0.0001 |
| Chol [mean (±SD)] | 5.5 (1.2) | 5.8 (1.3.) | 5.5 (1.4) | 5.6 (1.0) | 5.4 (1.2) | 0.29 |
| LDLc [mean (±SD)] | 3.6 (1.0) | 3.8 (1.1) | 3.4 (1.2) | 3.5 (1.0) | 3.4 (1.1) | 0.25 |
| Losartan group [n (%)] | 112 (50) | 28 (53) | 28 (54) | 25 (46) | 25 (45) | 0.75 |
| Loop diuretics [n (%)] | 164 (73) | 32 (60) | 36 (69) | 42 (78) | 49 (89) | 0.005 |
| Beta-blocker [n (%)] | 169 (75) | 42 (79) | 45 (87) | 40 (74) | 35 (64) | 0.04 |
BMI, body mass index; AMI, acute myocardial infarction; BP, blood pressure; eGFR, estimated glomerular filtration rate; BNP, B-type natriuretic peptide; Chol, cholesterol; LDLc, LDL-cholesterol.
A separate analysis was performed on the prognostic effects of changes in copeptin between baseline and 1 month. Both baseline copeptin levels and the percentual change of copeptin between baseline and 1 month were introduced as continuous variables in a multivariable Cox regression model for both mortality and the composite cardiovascular endpoint.
All tests were two-tailed and a P-value <0.05 was considered statistically significant. All analyses were performed with either SAS (Cary, NC, USA, version 9.1) or STATA (College Station, TX, USA, version 9.0).
Results
Baseline characteristics of the 224 patients of the present study according to quartiles of copeptin are described in Table 1. Overall, mean age was 68 ± 10 years, and mean follow-up was 33 ± 7 months. Copeptin levels increased with increasing age (P < 0.0001) and with decreasing renal function (P < 0.0001). In addition, levels of copeptin similarly increased with increasing levels of BNP and NT-proBNP (Table 1).
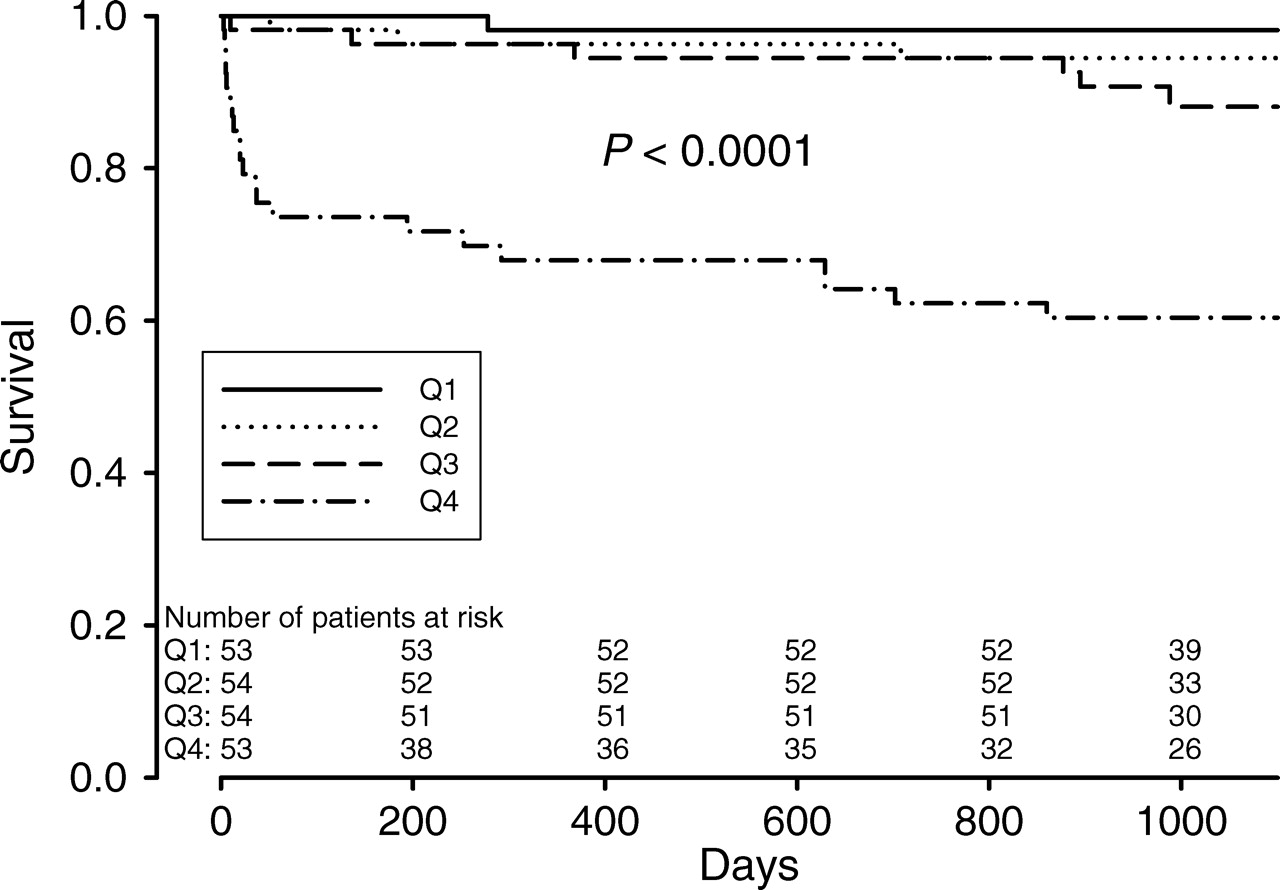
During follow-up, 32 patients died, and 63 patients reached the composite endpoint of death, MI, stroke, and/or resuscitated cardiac arrest. Plasma levels of copeptin, BNP, and NT-proBNP at baseline, 30 days, and 1 year are presented in Table 2. All neurohormones were highest at baseline and stabilized after 30 days. Figure 1 demonstrates survival according to quartiles of copeptin. Patients in the highest quartile had a significantly increased mortality compared with the other quartiles (P < 0.0001 among groups).
Kaplan–Meyer curves demonstrating freedom from death over time according to quartiles of copeptin at baseline.
Median (inter-quartile range) plasma levels of copeptin, B-type natriuretic peptide, and N-terminal-pro-B-type natriuretic peptide at baseline, 30 days, and 1 year after an acute myocardial infarction complicated by heart failure
| Baseline (n = 224) | 30 days (n = 203) | 1 year (n = 178) | |
|---|---|---|---|
| Copeptin [median (IQR)] (pmol/L) | 14 (8–26) | 7 (5–12) | 7 (5–11) |
| BNP [median (IQR)] (pmol/L) | 109 (59–182) | 74 (40–127) | 36 (22–78) |
| NT-proBNP [median (IQR)] (pmol/L) | 1223 (739–1981) | 763 (454–1244) | 382 (167–790) |
Univariable analysis
Univariable analysis demonstrated that higher age, a previous AMI, diabetes, hypertension, and a lower eGFR were significantly related to a higher mortality (Table 3). In addition, a higher copeptin [hazard ratio (HR) 2.27 per doubling; 95% confidence interval (CI) 1.76–2.93; P < 0.0001], BNP (HR 4.07 per doubling; 95% CI 1.80–9.18; P = 0.0007), and NT-proBNP (HR 6.46 per doubling; 95% CI 2.02–20.6; P = 0.0016) were all significantly related to a higher mortality.
Univariable Cox regression survival analysis of the predictive value of baseline variables on death and the composite endpoint of death/acute myocardial infarction/stroke/resuscitated cardiac arrest
| Variable | Death | χ2 | P-value | Composite endpoint | χ2 | P-value |
|---|---|---|---|---|---|---|
| Age (per year) | 1.14 (1.09–1.20) | 31.9 | <0.0001 | 1.06 (1.04–1.09) | 20.8 | <0.0001 |
| Female gender | 0.92 (0.44–1.95) | 0.04 | 0.83 | 1.09 (0.63–1.89) | 0.28 | 0.75 |
| BMI (per unit) | 0.93 (0.84–1.03) | 1.80 | 0.18 | 0.95 (0.89–1.02) | 1.71 | 0.19 |
| Smoking | 0.57 (0.26–1.23) | 2.07 | 0.15 | 0.77 (0.46–1.30) | 0.94 | 0.33 |
| History of AMI | 3.38 (1.56–7.31) | 9.55 | 0.0020 | 2.66 (1.47–4.82) | 10.3 | 0.0013 |
| Diabetes | 2.46 (1.06–5.68) | 4.41 | 0.036 | 1.82 (0.95–3.49) | 3.24 | 0.072 |
| Hypertension | 2.01 (1.01–4.03) | 3.90 | 0.048 | 1.29 (0.77–2.15) | 0.92 | 0.34 |
| Anterior AMI | 0.73 (0.36–1.46) | 0.80 | 0.37 | 0.92 (0.55–1.51) | 0.12 | 0.73 |
| SBP (mmHg) | 1.0 (0.98–1.02) | 0.02 | 0.89 | 1.01 (0.99–1.02) | 1.23 | 0.27 |
| eGFR (mL/min) | 0.95 (0.94–0.97) | 23.8 | <0.0001 | 0.98 (0.96–0.99) | 12.5 | 0.0004 |
| Chol (mmol/L) | 0.78 (0.57–1.06) | 2.47 | 0.12 | 0.94 (0.76–1.16) | 0.35 | 0.55 |
| LDL (mmol/L) | 0.85 (0.62–1.16) | 1.11 | 0.29 | 0.85 (0.67–1.07) | 1.89 | 0.17 |
| C-reactive protein (doubling) | 0.73 (0.44–1.20) | 1.56 | 0.21 | 1.0 (0.69–1.44) | 0.00 | 0.99 |
| Copeptin (doubling) | 2.27 (1.76–2.93) | 39.6 | <0.0001 | 1.55 (1.28–1.87) | 20.1 | <0.0001 |
| BNP (doubling) | 4.07 (1.80–9.18) | 11.4 | 0.0007 | 2.31 (1.33–4.00) | 8.91 | 0.0028 |
| NT-proBNP (doubling) | 6.46 (2.02–20.6) | 9.90 | 0.0016 | 3.18 (1.52–6.66) | 9.43 | 0.0021 |
| Losartan group | 1.13 (0.56–2.26) | 0.12 | 0.73 | 0.97 (0.59–1.59) | 0.01 | 0.91 |
| Diuretic use | 2.07 (0.80–5.38) | 2.24 | 0.13 | 1.70 (0.91–3.19) | 2.74 | 0.09 |
| Beta-blocker use | 0.53 (0.26–1.08) | 3.04 | 0.08 | 0.69 (0.41–1.17) | 1.88 | 0.17 |
Data are presented as HRs and 95% confidence intervals.
BMI, body mass index; AMI, acute myocardial infarction; SBP, systolic blood pressure; Chol, cholesterol; eGFR, estimated glomerular filtration rate; BNP, B-type natriuretic peptide.
The composite cardiovascular endpoint of death, MI, stroke, and/or resuscitated cardiac arrest was significantly more often observed in patients with higher age, a previous AMI, or a lower eGFR (Table 3). In addition, a higher copeptin (HR 1.55 per doubling; 95% CI 1.28–1.87; P < 0.0001), BNP (HR 2.31 per doubling; 95% CI 1.33–4.00; P = 0.0028), and NT-proBNP (HR 3.18 per doubling; 95% CI 1.52–6.66; P = 0.0021) were all significantly related to a higher incidence of the composite cardiovascular endpoint.
Multivariable analysis
Two multivariable Cox regression models were made. After adjustment for age and gender, copeptin was independently associated with mortality [HR 1.83 (1.36–2.46); P < 0.0001] and with the composite cardiovascular endpoint [HR 1.34 (1.09–1.67); P = 0.0065]. When adjusted for age, gender, renal function, previous MI, diabetes, and treatment group, copeptin remained independently associated with mortality [HR 1.83 (1.26–2.64); P = 0.0014] and with the composite cardiovascular endpoint [HR 1.35 (1.05–1.72); P = 0.018]. Both BNP and NT-proBNP were not significantly associated with mortality or the composite cardiovascular endpoint when adjusted for covariates (Table 4).
Multivariable Cox regression survival analysis of the predictive value of log copeptin, B-type natriuretic peptide, and N-terminal-pro-B-type natriuretic peptide on death and the composite endpoint of death/acute myocardial infarction/stroke/resuscitated cardiac arrest
| Variable | HR for death | χ2 | P-value | HR for composite endpoint | χ2 | P-value |
|---|---|---|---|---|---|---|
| Adjusted for and gender | ||||||
| Copeptin (doubling) | 1.83 (1.36–2.46) | 15.6 | <0.0001 | 1.34 (1.09–1.67) | 7.4 | 0.0065 |
| BNP (doubling) | 1.91 (0.85–4.36) | 2.4 | 0.12 | 1.67 (0.95–2.92) | 3.1 | 0.08 |
| NT-proBNP (doubling) | 2.0 (0.61–6.53) | 1.3 | 0.25 | 1.93 (0.89–4.21) | 2.8 | 0.10 |
| Adjusted for age, gender, previous MI, baseline renal function, diabetes, and treatment group | ||||||
| Copeptin (doubling) | 1.83 (1.26–2.64) | 10.2 | 0.0014 | 1.35 (1.05–1.72) | 5.6 | 0.018 |
| BNP (doubling) | 1.85 (0.79–4.31) | 2.0 | 0.15 | 1.67 (0.95–2.93) | 3.1 | 0.08 |
| NT-proBNP (doubling) | 1.30 (0.37–4.58) | 0.16 | 0.69 | 1.73 (0.75–3.99) | 1.7 | 0.20 |
Separate models were made for copeptin, BNP, and NT-proBNP.
Changes in copeptin
Separate analyses were performed on the predictive value of an increase in copeptin between baseline and 1 month after AMI on both endpoints. From a total of 197 patients, measurements of copeptin were available both at baseline and after 1month. When adjusted for baseline copeptin levels, a percentual change in copeptin between baseline and 1 month was significantly associated with an increased mortality [HR 3.5 (1.6–7.2) per 100% increase; P = 0.002] and an increased risk for the composite cardiovascular endpoint [HR 2.9 (1.7–5.0) per 100% increase; P = 0.0001].
Receiver operating characteristic analysis
Areas under the ROC curves were calculated for copeptin, BNP, and NT-proBNP for both endpoints. For mortality, areas under the ROC curves (95% confidence interval) were 0.81 (0.75–0.86) for copeptin, 0.66 (0.60–0.73) for BNP (copeptin vs. BNP: P = 0.0063; Figure 2), and 0.67 (0.61–0.74) for NT-proBNP (copeptin vs. NT-proBNP: P = 0.0016; Figure 2). For the composite cardiovascular endpoint, areas under the ROC curves were 0.67 for copeptin, 0.60 for BNP (copeptin vs. BNP: P = 0.17; Figure 3), and 0.61 for NT-proBNP (copeptin vs. NT-proBNP: P = 0.12; Figure 3). Sensitivity, specificity, positive and negative predictive values for death of copeptin, BNP, and NT-proBNP are presented in Table 5 at the cut-off level between the highest quartile and the lower three quartiles. None of these differences were however statistically significant.
Receiver operating characteristic curves for copeptin, N-terminal pro-B-type natriuretic peptide (NT-proBNP), and B-type natriuretic peptide (BNP) to predict mortality. Areas under the receiver operating characteristic curves were 0.81 for copeptin, 0.67 for N-terminal-pro-B-type natriuretic peptide, and 0.66 for B-type natriuretic peptide (copeptin vs. N-terminal-pro-B-type natriuretic peptide: P = 0.0016; copeptin vs. B-type natriuretic peptide: P = 0.0063).
Receiver operating characteristic curves for copeptin, N-terminal-pro-B-type natriuretic peptide (NT-proBNP), and B-type natriuretic peptide (BNP) to predict the composite endpoint of death/acute myocardial infarction/stroke/resuscitated cardiac arrest. Areas under the receiver operating characteristic curves were 0.67 for copeptin, 0.61 for N-terminal-pro-B-type natriuretic peptide, and 0.60 for B-type natriuretic peptide (copeptin vs. N-terminal-pro-B-type natriuretic peptide: P = 0.12; copeptin vs. B-type natriuretic peptide: P = 0.17).
Sensitivity, specificity, positive and negative predictive values for predicting death of copeptin, B-type natriuretic peptide, and N-terminal-pro-B-type natriuretic peptide at the cut-off level between the highest quartile and the lowest three quartiles
| Copeptin | BNP | NT-proBNP | |
|---|---|---|---|
| Cut-off (pmol/L) | 25.9 | 181 | 1980 |
| Sensitivity (%) | 67.7 | 50.0 | 53.1 |
| Specificity (%) | 82.5 | 79.2 | 79.9 |
| Positive predictive value (%) | 39.6 | 28.6 | 30.4 |
| Negative predictive value (%) | 93.8 | 90.5 | 91.1 |
| Copeptin | BNP | NT-proBNP | |
|---|---|---|---|
| Cut-off (pmol/L) | 25.9 | 181 | 1980 |
| Sensitivity (%) | 67.7 | 50.0 | 53.1 |
| Specificity (%) | 82.5 | 79.2 | 79.9 |
| Positive predictive value (%) | 39.6 | 28.6 | 30.4 |
| Negative predictive value (%) | 93.8 | 90.5 | 91.1 |
Discussion
The main and novel finding of the present study is that copeptin, a novel prognostic biomarker, is a strong marker for death and cardiovascular events in patients with signs and symptoms of heart failure after an AMI. The predictive value of copeptin for mortality appeared to be even stronger than that of both BNP and NT-proBNP.
Arginine vasopressin is synthesized in the hypothalamus in response to both a high osmolality and arterial hypovolaemia. Arginine vasopressin leads to vasoconstriction through the stimulation of the V1a receptor on vascular smooth muscle and leads to water re-absorption through the stimulation of V2 receptors in the collecting duct of the kidney.16 Several studies have demonstrated that AVP levels are increased in patients with chronic heart failure, and it is therefore assumed that AVP plays a pathophysiological role in the progression of heart failure.17–19 Since AVP secretion is partly stimulated in response to a high osmolality, it seems unexpected that AVP is increased in patients with heart failure, who generally have a lower osmolality. The following might be potential explanations. Still, the direct role of AVP in the pathophysiology of heart failure remains to be established. The oral vasopressin (V2) antagonist tolvaptan improved signs and symptoms of heart failure, but did not improve morbidity and mortality in patients hospitalized with heart failure.22,23 Interestingly, the response to treatment on tolvaptan was not better in patients with higher baseline AVP compared with patients with lower AVP levels.23 However, these findings might be explained by the instability and rapid clearance of AVP.24 Copeptin is the C-terminal portion of pro-vasopressin and is stable for days after sampling.12 Therefore, copeptin might better reflect stable levels of AVP related to the severity of the disease, rather than short-term variations of AVP due to non-disease-related mechanisms. This might also explain why copeptin levels are a good prognostic marker in heart failure. Recently, the prognostic value of copeptin was well demonstrated in patients with an AMI.5 In contrast to this study, patients from OPTIMAAL had signs and/or symptoms of heart failure.
Release of AVP in heart failure is mainly driven by a reduction in cardiac output, resulting in arterial underfilling, which activates the baroreceptors in the carotid sinus and the aortic arch. In heart failure, secretion of AVP by osmolar stimuli seems to be overridden by non-osmolar stimuli, leading to dilutional hypo-osmolality.20
Some studies have indicated that hyponatraemia, which is frequently present in heart failure patients, might also stimulate the release of AVP.21
In heart failure, angiotensin II levels are increased, even in the presence of ACE-inhibitors, and angiotensin II showed to increase AVP levels as well.21
An interesting additional observation of the present study was that the prognostic value for mortality of copeptin was superior compared with both BNP and NT-proBNP. Natriuretic peptides are very well established risk marker in several groups of patients, including patients with heart failure. Khan et al. studied 980 patients after MI and found a similar predictive value of copeptin and NT-proBNP.6 Stoiser et al. found that copeptin was superior compared with BNP in predicting death in 268 patients with advanced heart failure.7 Similarly, Neuhold et al. found that copeptin was superior to both BNP and NT-proBNP in predicting mortality in 786 heart failure patients.8 Compared with the Stoiser et al. and Neuhold et al. papers, our study is related to post-MI patients, and not advanced chronic heart failure patients. Compared with the paper by Khan et al., our study is a multicentre RCT in which patients had signs or symptoms of heart failure. In addition, we presented data on serial measurements, whereas the previous three studies were related to single measurements.
The area under curves (AUCs) of the ROC curves of 0.66 and 0.67, respectively, for BNP and NT-proBNP to predict mortality were lower than expected. However, although higher AUCs for BNP and NT-proBNP have been reported in acute heart failure, our findings are very similar compared with similar studies. For example, the AUCs in 3916 chronic heart failure patients were 0.67 for BNP and 0.68 for NT-proBNP.25 In addition, in two other chronic heart failure studies, AUCs for BNP were, respectively, 0.71 and 0.66.7,8 In this respect, an AUC of 0.81 for copeptin to predict mortality is very high. Our finding that the prognostic value of copeptin was better than both BNP and NT-proBNP makes our finding even more robust. Another possible explanation for our findings might be that BNP and NT-proBNP are more strongly correlated with age and renal function, which might influence its independent prognostic value. The relationships with age and renal function were however similar for our three biomarkers, suggesting differential correlations with these parameters do not explain our observations (data not shown). Another potential explanation might be that levels of BNP and NT-proBNP vary widely over time in patients with chronic heart failure, even when clinically stable.4 Although intra-individual variability over time has not been studied well with copeptin, a lower variability might have explained our findings. The circadian dependence of copeptin levels has not been analysed in detail so far, but serial measurements at day-time indicate a minimal intra-individual variation.12 Copeptin levels might however be influenced by physical exercise12,26 and disordered water states.27 In healthy humans, a 28 h water deprivation led to a twofold increase of copeptin, whereas infusion of hypotonic saline induced a 2–3-fold decrease of copeptin.27
Another interesting and novel finding of the present study was the added value of a second copeptin measurement after 1 month. An increase in copeptin between baseline and 1 month was associated with an increased risk of death and the composite cardiovascular endpoint. This implies that serial measurements of copeptin during follow-up might be of added value, although this has to be properly established in a ‘copeptin-guided-therapy’ study. However, since only 19 deaths occurred between 1 month and the end of follow-up, the statistical power of this analysis was limited. Overall, 32 patients died during follow-up, which also indicates that the statistical power of this study was confined, and that these data should be confirmed in a larger population of post-MI heart failure patients. Another important limitation is that data on infarct size and left ventricular function and dimensions were not available for this study. Finally, the assays that were used for BNP and NT-proBNP were not commercially available, which makes comparisons with the generally used assays impossible.
The findings of the present study are of clinical importance. B-type natriuretic peptide and NT-proBNP are currently widely used as an established risk marker in patients with chronic heart failure. If our results are confirmed by other studies, copeptin might further improve risk assessment in patients with chronic heart failure and better define the patient population at higher risk.
Funding
This study was supported by an unrestricted grant from Merck Research Laboratories, Bluebell, PA, USA, and by research grants from the Brandenburg Ministry of Economics, Germany, and the European Regional Development Fund (EFRE/ERDF).
Conflict of interest: D.J.V. and A.A.V. are Clinical Established Investigators of the Netherlands Heart Foundation (D97-017 and 2006T37). A.A.V. received a research grant from B.R.A.H.M.S., a biotech company that developed the C-terminal provasopressin (copeptin) assay; J.S., A.B., and O.H. are employed by B.R.A.H.M.S. B.R.A.H.M.S. holds patent applications with J.S. and A.B. as co-inventors on the use of copeptin for diagnostics. A.B. is a member of the board of directors and shareholder of B.R.A.H.M.S. S.D.A. has received consultant honoraria from B.R.A.H.M.S.

