


Abstract
Adenosine stress computed tomography myocardial perfusion imaging (CTP) is an emerging non-invasive method for detecting myocardial ischaemia. Its value when compared with fractional flow reserve (FFR), a highly accurate index of ischaemia, is unknown. Our aim was to determine the diagnostic accuracy of CTP and its incremental value when used with computed tomography coronary angiography (CTA) for detecting ischaemia compared with FFR.
Forty-two patients (126 vessel territories), who had at least one ≥50% angiographic stenosis on invasive angiography considered for non-urgent revascularization, were included and underwent FFR and CT assessment, including CTP, delayed contrast enhancement scan and CTA all acquired using 320-detector row CT, and prospective ECG gating. Fractional flow reserve was determined in 86 territories subtended by vessels with ≥50% stenosis upon visual assessment. Fractional flow reserve ≤0.8 was considered to indicate significant ischaemia. Computed tomography myocardial perfusion imaging correctly identified 31/41 (76%) ischaemic territories and 38/45 (84%) non-ischaemic territories. Per-vessel territory sensitivity, specificity, positive, and negative predictive values of CTP were 76, 84, 82, and 79%, respectively. The combination of a ≥50% stenosis on CTA and perfusion defect on CTP was 98% specific for ischaemia, while the presence of <50% stenosis on CTA and normal perfusion on CTP was 100% specific for exclusion of ischaemia. Mean radiation for CTP and combined CT was 5.3 and 11.3 mSv, respectively.
Computed tomography myocardial perfusion imaging is moderately accurate in identifying perfusion defects associated with ischaemia as assessed by FFR in patients considered for revascularization. In territories, where CTA and CTP are concordant, CTA/CTP is highly accurate in the detection and exclusion of ischaemia. This is achievable with acceptable radiation exposure using 320-detector row CT and prospective ECG gating.
Introduction
Adenosine stress computed tomography myocardial perfusion imaging (CTP) is an emerging non-invasive method used for the detection of myocardial ischaemia. In recent small pilot studies, the combination of computed tomography coronary angiography (CTA) and CTP was found to have a diagnostic accuracy comparable with combined quantitative coronary angiography (QCA) and single photon emission computed tomography (SPECT) imaging.1,2 Assessment for myocardial ischaemia is particularly important in stable coronary artery disease (CAD), as the presence of ischaemia is associated with adverse clinical outcomes and an ischaemia-guided approach to revascularization is associated with improved patient outcomes and functional status.3–5
Intracoronary pressure-derived fractional flow reserve (FFR) is a well-established invasive method to assess the functional significance of coronary stenoses with a high index of accuracy.6 It is independent of the heart rate, blood pressure, and left ventricular function. An FFR-guided approach for revascularization is associated with improved clinical outcomes in multi-vessel CAD.7 The accuracy of CTP when compared with FFR is not known. Our primary aim was to determine the diagnostic accuracy of CTP and combined CTA/CTP compared with FFR in a population considered for non-urgent revascularization.
Methods
Between June 2009 and 2011, we prospectively recruited 42 patients with chest pain with known CAD, including at least one ≥50% stenosis in a major epicardial artery as determined by visual assessment on invasive coronary angiography (ICA), who were considered for non-urgent revascularization. All participants underwent FFR and 320-detector row cardiac CT assessment, including CTP, delayed contrast enhanced (DE) scan, and CTA within 14 days of ICA. Exclusion criteria included age <50 years, myocardial infarction within 3 months, history of coronary artery bypass grafting, advanced atrioventricular block, atrial fibrillation, left ventricular dysfunction, severe left main (LM) disease, presence of chronic total occlusion, critical aortic stenosis, contraindications to iodinated contrast, bronchospastic lung disease requiring long-term steroid therapy, and renal insufficiency (eGFR <60 mL/min/1.73 m2). The study was approved by our institutional Ethics Committee and all participants gave written informed consent.
Invasive coronary angiography and fractional flow reserve
Invasive coronary angiography was performed as per standard practice via either femoral or radial approach. The pressure wire (Pressure Wire 5, Radi Medical Systems, Uppsala, Sweden) was calibrated and electronically equalized with the aortic pressure before being placed in the distal third of the coronary artery being interrogated. Intracoronary glyceryl trinitrate (100 mcg) was injected to minimize vasospasm. Intravenous adenosine was administered (140 mcg/kg/min) through an intravenous line in the antecubital fossa. At steady-state hyperaemia, FFR was recorded on the RadiAnalyzer Xpress (Radi Medical Systems), calculated by dividing the mean coronary pressure measured with the pressure sensor placed distal to the stenosis by the mean aortic pressure measured through the guide catheter. This procedure was repeated for all major epicardial arteries with ≥50% stenoses on ICA from visual assessment. Fractional flow reserve value of ≤0.8 was chosen to define ischaemia in an artery and its supplied territory.7,8
Quantitative coronary angiography
Quantitative coronary angiography was performed on all coronary arteries ≥1.5 mm in diameter using a 19-segment coronary model.9 This was performed using a semi-automated edge detection system (CMS Version 6, Medis Medical Imaging Systems, Ridgefield, CT, USA) by two experienced cardiologists (B.K., P.A.) who were blinded to FFR and CT findings with disagreement resolved by consensus. Each coronary segment was visually assessed for degree of luminal stenosis and a vessel was considered significant if there was ≥1 segment which was non-evaluable or with a ≥50% luminal stenosis.
Computed tomography protocol
Cardiovascular medications were ceased 48 h prior to scanning apart from beta-blockers. On arrival, two 18-gauge intravenous lines were inserted in both antecubital veins for the administration of adenosine and contrast. Oral and/or intravenous metoprolol was given if the resting HR was >65 b.p.m. The CT protocol is illustrated in Figure 1.
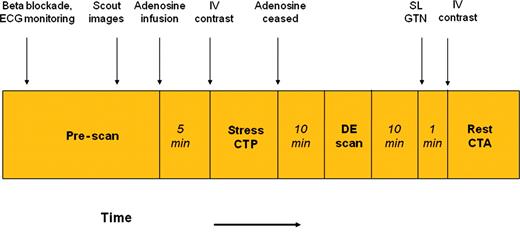
Cardiac computed tomography imaging protocol. See methods section for detailed explanation. After 5 min of intravenous adenosine infusion, contrast enhanced computed tomography myocardial perfusion imaging was acquired, followed by a non-contrast contrast enhanced scan after 10 min. Approximately 11 min later, a rest computed tomography coronary angiography was acquired after sublingual nitroglycerine. All three scans were acquired using prospectively ECG gating.
Computed tomography stress perfusion protocol
Patients were placed supine in a 320-row detector CT scanner (Aquilion ONE, Toshiba Medical Systems, Japan). After scout images, adenosine (140 mcg/kg/min) was infused with continuous ECG monitoring. Five minutes later, 55 mL of 100% Iohexal 56.6g/75 mL (Omnipaque 350) was injected at 5 mL/s, followed by 20 mL of a 30:70 mixture of contrast and saline, followed by 30 mL of saline. Scanning was triggered in the arterial phase using automated contrast bolus tracking with the region of interest placed in the descending aorta, and automatically triggered at 300 Hounsfield units (HU). Scanning parameters were: detector collimation 320 × 0.5 mm; tube current 300–500 mA [depending on body mass index (BMI)]; tube voltage 120 kV if BMI ≥25 (100 kV if BMI <25); gantry rotation time 350 ms; and temporal resolution 175 ms. Prospective electrocardiogram gating was used covering 70–95% of the R–R interval. For images acquired at heart rates ≤65 b.p.m. scanning was completed within a single R–R interval utilizing a 180° segment. In patients with a heart rate >65 b.p.m. data segments from two consecutive beats were used for multi-segment reconstruction with improved temporal resolution of 87 ms.
Delayed contrast enhancement imaging
Immediately after CTP, the adenosine infusion was discontinued. Ten minutes later, DE imaging was performed using a tube voltage of 120 kV, tube current 250 mA, and prospective electrocardiogram gating covering 75% of the R–R interval.
Rest computed tomography coronary angiography
Following the DE scan, a rest CTA was obtained 1min after administration of sublingual nitrates, using prospective electrocardiogram gating at 70–80% of the R–R interval, tube settings, and contrast dose as for the stress scan.
Radiation exposure
Effective radiation dose for each component of the CT protocol was calculated by multiplying the dose-length product by a constant (k = 0.014 mSv/mGy/cm).10
Computed tomography angiography analysis
CT angiographic images were analysed on a dedicated workstation (Vitrea FX 2.0, Vital Images, Minnetonka, MN, USA) by an experienced CT angiographer (ML) blinded to CTP, QCA, and FFR results. All segments ≥1.5 mm were analysed using the same 19-segment coronary model as QCA.9 Each coronary segment was visually assessed for degree of luminal stenosis and a vessel was considered significant if there was ≥1 segment which was non-evaluable or with a ≥50% luminal stenosis.
Computed tomography myocardial perfusion analysis
Data sets were reconstructed at 80% of the R–R interval, with further reconstructions at 3% intervals as required to optimize detection of beam hardening and motion artefacts (Figure 6). The phase with the least cardiac motion was selected and a short-axis multiplanar reconstruction series created using 3 mm slices. Images were displayed using a narrow window level (typically 200 HU, level 100 HU) and reported by two independent blinded observers (S.S., S.L.), according to the American Heart Association 17-segment model11 with disagreement resolved by a third reader (S.H.).
Each of the 17 myocardial segments was scored on the absence or presence of a perfusion defect upon visual assessment. Perfusion defects were classified as transmural (≥50% myocardial wall thickness) or non-transmural (<50% wall thickness). Reversibility was defined as 0 = none, 1 = minimal, 2 = partial, 3 = complete. In addition, for each data set image quality was determined by a three point scale: 1 = poor, 2 = moderate, 3 = good. In the combined CTA/CTP analysis, vessel territories were considered positive when CTA demonstrated a ≥50% stenosis and/or CTP showed a perfusion defect.
Matching of perfusion segments to vessel territories
To ensure correct association of the 17 myocardial segments with the subtended coronary territory, we took into account whether: (i) the left circumflex (LCx) or right coronary artery (RCA) supplied the inferior wall, (ii) the anterolateral wall was supplied by the left anterior descending artery (LAD) via a diagonal vessel overlying the anterolateral wall, (iii) the inferolateral wall was supplied by the RCA by an overlying right posterolateral branch, (iv) the distal LAD wrapped around the apex to supply the distal inferior wall or (v) the LAD septal perforator supplied the inferior septum.
Statistical analysis
Continuous variables are expressed as mean ± SD, whereas categorical variables are expressed as percentage. Sensitivity, specificity, positive predictive value (PPV), and negative predictive value (NPV) were calculated to predict the ability of each imaging modality to identify myocardial ischaemia on a per vessel territory basis, taking into account intracluster correlation (ICC = 0.35). Per patient analysis was performed assuming that the territories subtended by <50% stenosis on visual assessment were not significant on FFR. Subgroup differences in diagnostic accuracy were assessed using χ2 testing. Kappa (k) statistic values were used to assess the inter-observer agreement for CTP and per vessel territory concordance between CTP, QCA, and FFR. The Mann–Whitney U test was used to compare median FFR and QCA and the Wilcoxon signed-rank test to assess the deviation of median FFR values from 0.8. Statistical significance was assessed as P < 0.05 using a two-tailed probability analysis. Data were analysed using Graph Prism 5.0, (Graph Pad Software, CA, USA).
Results
Patient population
Five hundred and fifty-three patients undergoing clinically indicated coronary angiography who met inclusion criteria were screened. Of these, 24 (4%) were excluded because of severe LM disease, 85 (15%) due to chronic total occlusions, 171 (31%) due to left ventricular dysfunction, 65 (12%) due to atrial fibrillation, 77 (14%) had been enrolled in another study and 89 (16%) declined participation (Figure 2). Forty-two patients (mean age 65.1 ± 8.3 years, 64% male) were enrolled and underwent FFR and CT assessment. Patient characteristics are summarized in Table 1.
Patient characteristics (n= 42)
| Characteristic | Value |
|---|---|
| Age (years), mean ± SD | 65.1 ± 8.3 |
| Male % (n) | 64.3 (27) |
| Body mass index (kg/m2), mean ± SD | 27.9 ± 6.5 |
| Hypertensiona, % (n) | 88.1 (37) |
| Hyperlipidaemiab, % (n) | 69.0 (29) |
| Current smoker, % (n) | 16.7 (7) |
| Diabetes, % (n) | 21.4 (9) |
| Family hx of IHD, % (n) | 40.5 (17) |
| Obesityc, % (n) | 40.5 (17) |
| Previous infarction, % (n) | 11.9 (5) |
| Previous PCI, % (n) | 21.4 (9) |
| Medication, % (n) | |
| Aspirin | 95.2 (40) |
| Clopidogrel | 50.0 (21) |
| β-Blocker | 59.5 (25) |
| ACE-inhibitor | 33.3 (14) |
| ARB | 35.7 (15) |
| Statin | 85.7 (36) |
| Calcium channel blocker | 40.4 (17) |
SD, standard deviation; IHD, ischaemic heart disease; PCI, percutaneous coronary intervention; ACE, angiotensin-converting enzyme; ARB, angiotensin receptor blocker.
aBlood pressure >140/90 mmHg or treatment for hypertension.
bTotal cholesterol >180 mg/dL or treatment for hypercholesterolaemia.
cBody mass index >30 kg/m2.
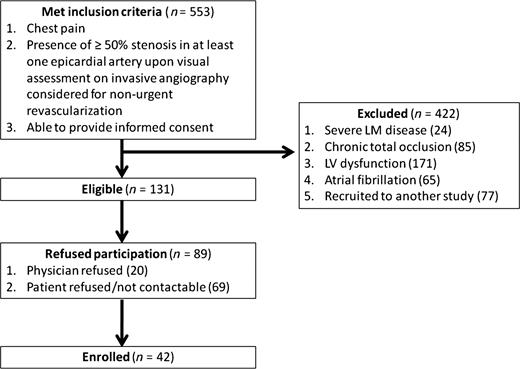
Patient flow diagram. In the 553 patients who were screened and met inclusion criteria, 422 were excluded. Forty-two patients were enrolled and completed the entire protocol.
Computed tomography acquisition data
Table 2 demonstrates the CT scan parameters. Mean radiation exposure for CTP, CTA, and total CT assessment were 5.3 ± 2.2, 4.8 ± 2.6, and 11.3 ± 3.9 mSv, respectively. Mean radiation exposure for one and two beat CTP studies were 4.7 and 5.6 mSv, respectively. Six patients (14%) had undergone clinically mandated rest CTA acquired using dose modulated retrospective ECG gating within 48 h of recruitment, hence rest CTA was not repeated in these patients.
Computed tomography scan parameters
| Parameter | CTP | CTA | DE |
|---|---|---|---|
| Heart rate (b.p.m.)a, mean ± SD | 69.6 ± 16.7 | 56.9 ± 8.6 | 56.4 ± 9.3 |
| Rhythma, n (%) | |||
| Sinus rhythm | 41 (98) | 42 (100) | 42 (100) |
| Junctional tachycardia | 1 (2) | 0 (0) | 0 (0) |
| Beta-blocker usage, n (%) | 26 (62) | 29 (69) | 26 (62) |
| Oral metoprolol | 24 (57) | 25 (60) | 24 (57) |
| Intravenous metoprolol | 8 (21) | 9 (21) | 9 (21) |
| Beta-blocker dose (mg), mean±SD | |||
| Oral metoprolol | 77 ± 53 | 76 ± 49 | 77 ± 53 |
| Intravenous metoprolol | 11 ± 6 | 14 ± 10 | 11 ± 6 |
| ECG gating, n (%) | |||
| Prospective | 42 (100) | 37 (88) | 42 (100) |
| Retrospective | 0 (0) | 5 (12) | 0 (0) |
| Gantry rotationsa, n (%) | |||
| 1 | 15 (48) | 38 (90) | 42 (100) |
| 2 | 26 (52) | 4 (10) | 0 (0) |
| Tube voltage (kV), mean ± SD | 118 ± 7 | 119 ± 5 | 118 ± 5 |
| Tube current (mAs), mean ± SD | 271 ± 157 | 232 ± 171 | 81 ± 23 |
| Dose length product (mGy-cm), mean ± SD | 379 ± 157 | 343 ± 186 | 86 ± 36 |
| Radiation exposure (mSv), mean ± SD | 5.3 ± 2.2 | 4.8 ± 2.6 | 1.2 ± 0.5 |
| Image quality (using subjective three-point scale), mean ± SD | 2.3 ± 0.8 | 2.3 ± 0.7 | 2.3 ± 0.8 |
aAt time of CT image acquisition.
Computed tomography coronary angiography
Among the 42 CTA examinations, 3 (2%) vessel territories had at least one non-evaluable segment all in a single patient, secondary to heavy calcification. Mean image quality was 2.3 ± 0.7. Sixty-three (50%) vessel territories had significant disease. Four (10%) patients had no significant disease, 20 (48%) had one-vessel disease, 11 (26%) had two-vessel disease, and 7 (17%) had triple-vessel disease.
Computed tomography myocardial stress perfusion imaging
Thirty-one (74%) patients with 40 (32%) vessel territories had perfusion abnormalities identified (example in Figure 3). There was good inter-observer agreement (88%) in identification of abnormal perfusion per vessel territory with a kappa value of 0.73 (95% confidence interval: 0.61–0.86).
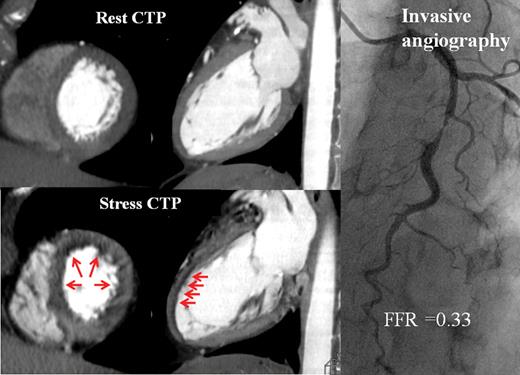
Computed tomography perfusion imaging and invasive angiography. Fifty-five-year-old lady with chest pain. Computed tomography myocardial perfusion imaging demonstrated, on axial and sagittal cuts, reversible non-transmural ischaemia in the mid- to distal-anterior, anteroseptal, and anterolateral walls (red arrows). On invasive angiography, there was a severe stenosis in the mid-left anterior descending artery, with a fractional flow reserve of 0.33 recorded in the distal vessel.
In patients with perfusion abnormalities on CTP, 22 (52%) had a defect involving one-vessel territory and 9 (21%) had defects in two-vessel territories. Of these, 24 (60%) were located in the LAD territory, 12 (30%) in LCx territory, and 4 (10%) in RCA territory. Eighteen (45%) were transmural defects.
Using myocardial attenuation on rest CTA for comparison, all perfusion abnormalities identified on CTP were reversible. Five (13%) were minimally reversible, 14 (35%) partially reversible, and 21 (53%) were completely reversible. Image quality was moderate or good in 106 (84%) vessel territories. In the remaining 20 (16%) territories, image quality was poor due to increased image noise or motion artefact.
Delayed contrast enhancement imaging
In all studies with perfusion abnormalities on stress imaging, there were no corresponding areas of delayed enhancement. Mean radiation exposure was 1.2 ± 0.5 mSv and mean image quality was 2.3 ± 0.8.
Quantitative coronary angiography
On QCA, 33 patients (79%) had ≥50% and 10 patients (24%) had ≥70% stenosis in at least one coronary vessel. Twenty-four patients (57%) had single-vessel disease, 5 (12%) had double-vessel disease, and 4 (10%) had three-vessel disease. On a per vessel basis, 37% of the 126 vessel studies had ≥50% stenosis, whereas 10% had ≥70% stenosis. When diameter stenoses (DS) on QCA ≥50 and 70% were chosen to denote significant stenoses, the diagnostic accuracy for detection of ischaemia as assessed by FFR was 66 and 64%, respectively (Table 3).
Per vessel territory diagnostic accuracy of computed tomography coronary angiography, computed tomography myocardial perfusion imaging, and quantitative coronary angiography compared with fractional flow reserve (n= 86)
| CTA DS ≥50% | Perfusion defect on CTP | CTA DS ≥50% and perfusion defect on CTP | CTA DS ≥50% or perfusion defect on CTP | QCA DS ≥50% | QCA DS ≥70% | |
|---|---|---|---|---|---|---|
| True positive (n) | 38 | 31 | 28 | 41 | 29 | 11 |
| False positive (n) | 18 | 7 | 1 | 24 | 17 | 1 |
| True negative (n) | 27 | 38 | 44 | 21 | 28 | 44 |
| False negative (n) | 3 | 10 | 13 | 0 | 12 | 30 |
| Sensitivity (%) | 93 (84–100) | 76 (62–89) | 68 (54–83) | 100 (89–100) | 71 (55–87) | 27 (12–41) |
| Specificity (%) | 60 (43–77) | 84 (73–96) | 98 (93–100) | 47 (31–63) | 62 (47–78) | 98 (93–100) |
| PPV (%) | 68 (53–82) | 82 (67–96) | 97 (89–100) | 63 (49–77) | 63 (46–80) | 92 (72–100) |
| NPV (%) | 90 (79–100) | 79 (65–93) | 77 (64–90) | 100 (81–100) | 70 (54–86) | 59 (48–71) |
| Kappa statistic | 0.52 (0.35–0.69) | 0.60 (0.43–0.77) | 0.67 (0.52–0.82) | 0.52 (0.37–0.68) | 0.33 (0.13–0.53) | 0.25 (0.10–0.40) |
| Accuracy (%) | 76 | 80 | 84 | 73 | 66 | 64 |
Fractional flow reserve
Fractional flow reserve was performed successfully in all 42 patients involving 86 territories subtended by ≥50% stenosis upon visual assessment on invasive angiography. Twelve (29%) patients received FFR interrogation in one-vessel territory, 16 (38%) two, and 14 (33%) had all three-vessel territories interrogated. Overall FFR was performed in 68% of all vessel territories with readings ranging from 0.27 to 0.99 (mean, 0.77 ± 0.17). Median QCA in the territories which were and were not assessed with FFR was 51 and 26%, respectively. In the latter group there were no arteries with ≥50% stenosis on QCA. Fractional flow reserve was ≤0.8 in 41 (48%) vessel territories, 21 (51%) occurred in LAD, 10 (24%) in LCX, and 10 (24%) in RCA territory.
Accuracy of computed tomography coronary angiography and computed tomography myocardial perfusion imaging compared against fractional flow reserve
In the vessels interrogated with FFR, CTA had a sensitivity, specificity, PPV, and NPV of 93, 60, 68, 90%, respectively (Table 3).
The relationship between CT perfusion and FFR is summarized in Figure 4A. The median FFR value in territories with a perfusion defect on CTP was significantly lower than in territories with normal myocardial perfusion (FFR; perfusion defect 0.72, normal myocardium 0.88, P< 0.0001). Computed tomography myocardial perfusion imaging correctly identified 31/41 (76%) ischaemic territories and 38/45 (84%) non-ischaemic territories. There were 10 false negative territories, 6 in the RCA, 2 in the LAD, and 2 in the LCx territories. There were seven false positive territories, three in the LAD, and four in the LCx territories.
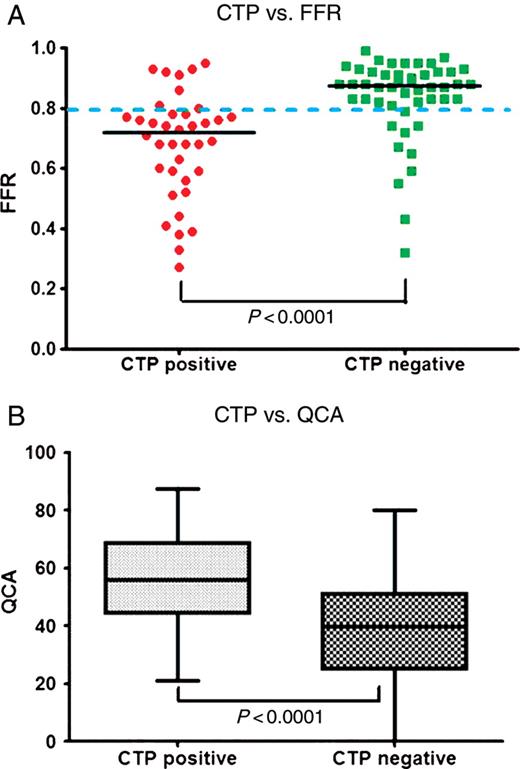
Relationship between computed tomography myocardial perfusion imaging vs. fractional flow reserve and quantitative coronary angiography. (A) Computed tomography myocardial perfusion imaging vs. fractional flow reserve (n= 86 territories), the median fractional flow reserve is marked with a black line; 0.72 with perfusion defect vs. 0.88 with normal myocardial perfusion (P< 0.0001). (B) Computed tomography myocardial perfusion imaging vs. quantitative coronary angiography (n= 126 territories), the median diameter stenoses is represented by the horizontal line inside the box; 56% with perfusion defect vs. 40% with normal myocardial perfusion (P< 0.0001).
The diagnostic accuracy of CTP when compared against FFR is summarized in Table 3. The sensitivity was 76%, specificity 84%, PPV 82%, and NPV 79%. There was a moderate concordance found in the ability of the two methods to detect ischaemia (k = 0.60, confidence interval: 0.43–0.77). Diagnostic accuracy was 80%.
There was no difference in diagnostic accuracy in patients with or without prior myocardial infarction (70 vs. 82%, P= 0.39), with or without previous PCI (76 vs. 82%, P= 0.59) and in patients who did or did not receive beta-blockade for the purpose of CT perfusion imaging (80 vs. 80%, P= 0.97).
Comparison of computed tomography perfusion against quantitative coronary angiography
The relationship between CT perfusion and QCA in all territories is summarized in Figure 4B. The median DS on QCA in territories with a perfusion defect on CTP were significantly higher than corresponding DS on QCA in territories with normal myocardial perfusion (56 vs. 40% P < 0.0001).
On a per vessel territory basis, CTP had a sensitivity of 50 and 75% and a specificity of 79 and 73% for the detection of DS ≥50 and 70% on QCA, respectively.
Accuracy of combined computed tomography coronary angiography/computed tomography myocardial perfusion imaging against fractional flow reserve
The relationship between combined CTA/CTP assessment and FFR is summarized in Figure 5. There were 29 territories (34%) which had ≥50% stenosis on CTA and abnormal perfusion. All of these territories except one (97%) had an FFR ≤0.8. Similarly, there were 21 territories which had <50% stenosis on CTA and normal perfusion. All of these territories had an FFR >0.8. There were 27 territories (27%) which had ≥50% stenosis on CTA but normal perfusion on CTP. Of these, 10 (37%) territories were found to have significant ischaemia on FFR,, i.e. false negative territories. Similarly, there were nine territories (10%) which had <50% stenosis on CTA with a perfusion defect on CTP, of which six (67%) were found to be non-ischaemic,, i.e. false positive territories. Overall, when CTA/CTP was considered positive when subtended by ≥50% stenosis on CTA and a perfusion defect on CTP, sensitivity was 68%, NPV 77%, specificity 98%, and PPV 97%. In contrast, when CTA/CTP was considered positive when subtended by a ≥50% stenosis on CTA or a perfusion defect on CTP, specificity was 47%, PPV 63%, sensitivity and NPV were 100% (Table 3).
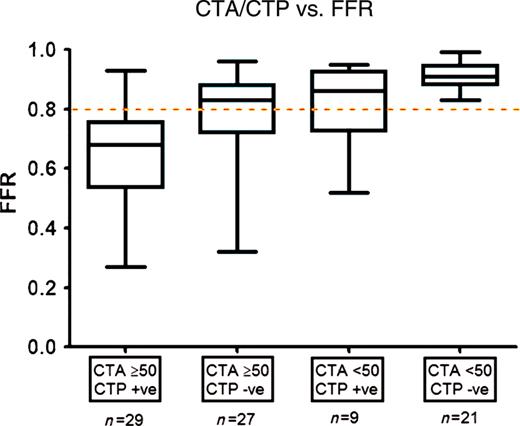
Relationship between computed tomography coronary angiography/computed tomography myocardial perfusion imaging vs. fractional flow reserve (n = 86 territories). Median fractional flow reserve in territories with (i) ≥50% stenosis on computed tomography coronary angiography with a perfusion defect on computed tomography myocardial perfusion imaging, (ii) ≥50% stenosis on computed tomography coronary angiography with normal perfusion on computed tomography myocardial perfusion imaging, (iii) <50% stenosis on computed tomography coronary angiography with a perfusion defect on computed tomography myocardial perfusion imaging, and (iv) <50% stenosis on computed tomography coronary angiography with normal perfusion on computed tomography myocardial perfusion imaging was 0.68, 0.83, 0.86 and 0.91, respectively. Deviation from the ischaemic threshold (fractional flow reserve = 0.8) was P< 0.0001, P= 0.85, P= 0.51, and P< 0.0001, respectively.
Accuracy on a per patient basis
Per patient sensitivity, specificity, PPV, and NPV were 96% (79–100%), 71% (42–90%), 87% (69–96%), and 91% (57–100%), respectively, for CTP; 96% (79–100%), 21% (6–51%), 71% (54–84%), and 75% (22–99%), respectively, for CTA; and 86% (67–95%), 85% (54–97%), 93% (74–99%), and 73% (45–91%) for combined CTA/CTP.
Discussion
This study is the first to report the accuracy of CT stress myocardial perfusion imaging compared with an invasive functional standard—fractional flow reserve, and the first to assess myocardial perfusion using 320-row detector CT technology. We demonstrate in patients with known CAD considered for revascularization, CT stress imaging alone has a moderate accuracy in detecting ischaemia as determined by FFR. The use of CTP in addition to CTA highly increases the ability of CTA to predict ischaemia when their findings are concordant. The presence of a perfusion defect in territories with a ≥50% stenosis is highly specific for ischaemia while the presence of normal perfusion in territories subtended by an artery with a <50% stenosis excludes ischaemia with 100% accuracy in our series. When the CTA and CTP findings are discordant, accuracy is comparatively decreased. Combined CTA/CTP can be achieved using prospective ECG gating, with an acceptable radiation dose of 11.3 mSv.
Fractional flow reserve as reference standard
Two previous studies have assessed the per vessel accuracy of CTP with a sensitivity of 79 and 93% and specificity of 91 and 74% when the reference standard was defined as ≥50% stenosis on QCA with a corresponding perfusion abnormality on SPECT.1,2 However, SPECT is not an ideal reference standard particularly in the multi-vessel ischaemia. This discordance was highlighted in a group of 67 patients with angiographic 2- or 3-vessel disease, with 58% of ischaemic territories either underestimated or overestimated by SPECT in comparison with FFR.12 We chose FFR as our reference standard for three reasons. First, it is vessel territory specific and its value is not influenced by the presence or absence of ischaemia in adjacent territories. Second, FFR values >0.8 are associated with negative ischaemic results with a predictive accuracy of 95%.8 Lastly, multiple randomized and observational studies have confirmed the clinical utility of FFR in multi-vessel disease and revascularization guided by FFR has been found to improve clinical outcomes.4,7,13,14 However, it should be noted that FFR is determined by assessment of flow in the major epicardial arteries alone without taking into account microvascular disease. The presence of microvascular ischaemia alone may not be associated with a significant FFR.
Prospective ECG gated 320-detector row dynamic volume computed tomography imaging
This is the first study to report the novel use of a 320-detector row dynamic volume CT to assess myocardial perfusion. Earlier generation 64-slice MDCT scanners were limited by its inherent longitudinal axis coverage of 4 cm. The main disadvantage was that perfusion assessment of the entire heart would require multiple gantry rotations involving five to eight heartbeats, and thus time-resolved perfusion assessment of the entire heart volume was not possible. This was associated with a prolonged breath-hold time of 8–10 s, increased total beam exposure duration and hence a higher radiation dose. The use of a 320-detector row scanner allowed the longitudinal axis to increase from 4 to 16 cm, which enabled the entire heart volume to be imaged in a single gantry rotation and required a breath-hold time of 1–2 s. Importantly, single gantry rotation would ensure temporal contrast distribution of the entire volume,15 and wider-detector coverage would overcome the problem of slab misregistration artefacts that occurred when adjacent volumes were acquired at two different heart beats.
In earlier studies, CT perfusion images were acquired using retrospective ECG gating with radiation exposure up to 21.6 mSv.2 This is the first study to evaluate the accuracy of CTP using a prospective electrocardiogram-gated imaging technique covering a 70–95% phase window, chosen to minimize radiation exposure. Total radiation exposure of 11.3 ± 3.9 mSv for our comprehensive CT protocol is comparable with SPECT imaging1 which provides assessment of perfusion without coronary anatomy.
Computed tomography coronary angiography/computed tomography myocardial perfusion imaging as one imaging modality
Our findings highlight the accuracy of combined CTA and CTP assessment compared against FFR when their findings are concordant. While ≥50% stenosis on CTA is highly sensitive for ischaemia as assessed by FFR, it lacks specificity. Our findings are in agreement with published literature.16 Computed tomography coronary angiography can be complimented by CTP which is more specific for ischaemia. When the two modalities are concordant (≥50% luminal stenosis on CTA and a perfusion defect on CTP), CTA/CTP is highly specific in predicting ischaemia compared with FFR. Similarly in territories with <50% stenosis and normal perfusion, ischaemia may be excluded safely. In the current study, CTA and CTP were concordant in 58% of sampled territories. Recent trials indicate that ischaemia-driven revascularization improves clinical outcomes3,5,7,17 and in the absence of ischaemia revascularization is controversial and may be associated with adverse outcomes.14,18 In the concordant cases, CTP enhanced the ability of CTA in predicting an FFR ≤0.8, which may obviate the need for further investigation including FFR as a guide for determining revascularization strategy.
The clinical decision to revascularize an artery is often based on angiographic DS ≥70% and only 50% of patients may undergo a functional test prior to revascularization.19 Computed tomography coronary angiography/computed tomography myocardial perfusion imaging compared favourably against invasive QCA assessment in predicting myocardial ischaemia with a diagnostic accuracy of 0.84 vs. 0.64, respectively. Although it is highly specific for ischaemia, QCA failed to detect 73% (30/41) of all ischaemic territories which suggests that percent DS is a suboptimal indicator of haemodynamically significant disease. In our study population who were all under consideration for revascularization, CTP or CTP in combination CTA would have served as a superior guide for revascularization than QCA alone (Table 3).
Discrepancies between computed tomography myocardial perfusion and fractional flow reserve
While the reported PPV and specificity of CTP were higher than CTA, the relationship between CTP and FFR remained imperfect. Furthermore, when the CTA and CTP findings were discordant, there was a lower agreement between CTA/CTP and FFR. In territories with a ≥50% stenosis on CTA and normal perfusion on CTP, 37% were ischaemic as assessed on FFR. Similarly in territories with a <50% stenosis on CTA and a perfusion defect on CTP, 67% of territories were not ischaemic on FFR.
There are several potential mechanisms that could explain the discrepancies between CTP and FFR. False positive territories may be a result of artefacts or microvascular dysfunction.1,20 Artefacts are most commonly due to beam hardening or motion (see example in Figure 6), especially in the presence of tachycardia driven by adenosine-induced hyperaemia (Table 2). False negatives may be secondary to small size of perfusion defect, inadequate window width and level, and overlying motion artefacts which preclude accurate assessment of certain territories (see example in Figure 7).
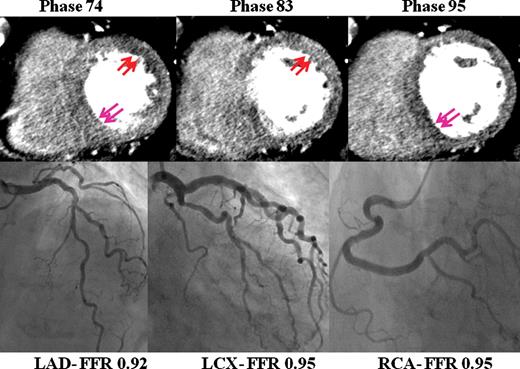
Motion artefacts. Seventy-eight-year-old lady for investigation of chest pain on background of type 2 diabetes. Fractional flow reserve of all three major epicardial vessels were not significant. On computed tomography myocardial perfusion imaging, the mid-axial cuts demonstrate apparent perfusion abnormalities in the anterolateral wall in phase 74 (red arrows), not present in phase 83. Similarly apparent perfusion abnormalities are present in the inferoseptal wall in phase 95 (blue arrows), yet absent in phase 74. ‘Shifting perfusion abnormalities’ which are not seen on all phases are secondary to artefacts. In this case, this may be secondary to contrast enhancement of the left ventricle or motion. The heart rate during computed tomography myocardial perfusion imaging was 80 b.p.m.
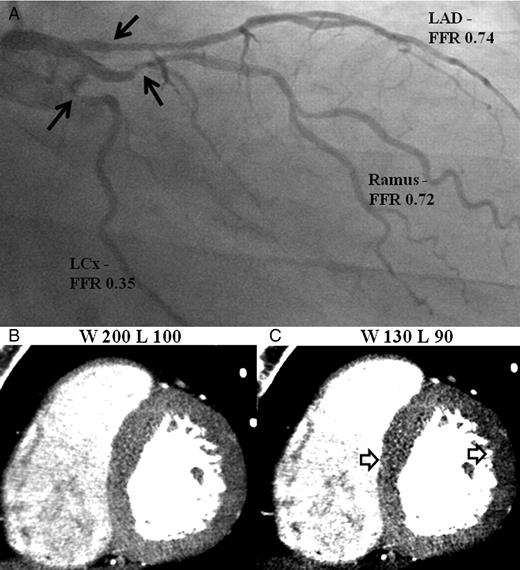
Example of inadequate window width and level resulting in false negative territories. (A) Invasive angiography demonstrate significant stenoses in the proximal left anterior descending artery, Ramus, and left circumflex arteries (black arrows). (B) and (C) Computed tomography perfusion images displayed in the mid-axial cuts demonstrate no perfusion defects using settings W200/L100 which become apparent at W130/L90 (white arrows).
The history of previous myocardial infarction was not found to influence the diagnostic accuracy of CTP against FFR. In these patients, there was no detectable myocardial wall thinning on CT, which indicates that their previous infarcts were likely small in size and may explain the lack of delayed contrast enhancement. Notably patients with larger infarcts resulting in regional wall motion abnormalities as detected on left ventriculogram or transthoracic echocardiogram were excluded from participation in our study.
Future technological advances may enhance the diagnostic accuracy of CTA/CTP. Specifically, improvements may involve improved temporal resolution to reduce motion artefacts that are seen during increased heart rate, improved spatial resolution, and improved beam hardening correction algorithms.
Anatomic concordance between computed tomography coronary angiography and quantitative coronary angiography
In our cohort, four patients were identified to significant triple vessel CAD as determined by QCA. However, seven patients were observed to have significant triple vessel disease based on CTA. This may be explained by the tendency for QCA to underestimate lesion severity especially in eccentric lesions, calcified stenoses, and tortuous vessels.21
Furthermore, the observed accuracy of CTA was similar to QCA (76 vs. 73%) compared against FFR. Our results are consistent with the reported accuracy in recent literature.16,22,23 This ranged from 64 to 90% in patients with suspected CAD using ≥50% stenosis upon visual assessment on CTA.16 Similarly, the reported sensitivity and specificity of QCA in large meta-analyses in 1522 lesions with 30–70% stenoses were 76% and 54% when compared against FFR.23
Limitations
Our results represent a single-centre experience involving 42 patients needing confirmation with larger multi-centre studies. Similar to other recent studies, our study population included a selected group of symptomatic patients with a high prevalence of CAD,1,2 who were considered for revascularization. The reported accuracy of CTP should be interpreted within this context.
Fractional flow reserve was only measured in vessels with ≥50% stenosis on visual assessment. This comprised 68% of all vessel territories. All the vessels which were not interrogated using FFR were subsequently confirmed to have <50% stenosis on QCA. While this was performed to simulate real-world practice and to avoid potential iatrogenic complications, it is notable that an abnormal FFR can be found in coronary arteries with a <50% stenosis. For this reason, only the vessel territories which were interrogated by FFR were included for the per vessel territory analysis. Per patient analysis was calculated under the assumption that the territories which were subtended by <50% stenosis on invasive angiography which were not assessed on FFR were not ischaemic.
Beta-blockers were administered in 64% of the perfusion studies. In our study population, the use of beta-blockers administered before CTP acquisition was not found to influence the diagnostic accuracy of CTP. While beta-blockers may mask perfusion defects in exercise and dobutamine nuclear perfusion imaging, effects upon vasodilator perfusion imaging and coronary flow reserve have been inconsistent.24–26
Interpreters of CTP were not completely blinded from the available coronary data on the stress perfusion images. They were however instructed not to intentionally assess the coronary arteries during perfusion assessment. In clinical application, the coronary arteries and myocardial perfusion assessment would occur concomitantly.
Finally, combined CTA/CTP requires double the iodinated contrast dose (∼120 mL) compared with CTA alone requiring caution in patients with abnormal renal function.
Conclusion
Computed tomography myocardial perfusion imaging is moderately accurate in identifying perfusion defects associated with ischaemia as assessed by FFR in patients considered for coronary revascularization. Combined CTA/CTP is feasible with an acceptable radiation dose using prospective ECG gating and 320-detector row CT. Computed tomography coronary angiography/computed tomography myocardial perfusion imaging is highly accurate in the detection and exclusion of ischaemia when CTA and CTP findings are concordant. Before this technique can be incorporated into routine clinical practice, larger multi-centre studies are required to investigate its diagnostic accuracy as a stand-alone imaging modality for myocardial ischaemia.
Conflict of interest: none declared.

