


Abstract
The time course of atherosclerosis burden in distinct vascular territories remains poorly understood. We longitudinally evaluated the natural history of atherosclerotic progression in two different arterial territories using high spatial resolution magnetic resonance imaging (HR-MRI), a powerful, safe, and non-invasive tool.
We prospectively studied a cohort of 30 patients (mean age 68.3, n = 9 females) with high Framingham general cardiovascular disease 10-year risk score (29.5%) and standard medical therapy with mild-to-moderate atherosclerosis intra-individually at the level of both carotid and femoral arteries. A total of 178 HR-MRI studies of carotid and femoral arteries performed at baseline and at 1- and 2-year follow-up were evaluated in consensus reading by two experienced readers for lumen area (LA), total vessel area (TVA), vessel wall area (VWA = TVA − LA), and normalized wall area index (NWI = VWA/TVA). At the carotid level, LA decreased (−3.19%/year, P = 0.018), VWA increased (+3.83%/year, P = 0.019), and TVA remained unchanged. At the femoral level, LA remained unchanged, VWA and TVA increased (+5.23%/year and +3.11%/year, both P < 0.01), and NWI increased for both carotid and femoral arteries (+2.28%/year, P = 0.01, and +1.8%/year, P = 0.033).
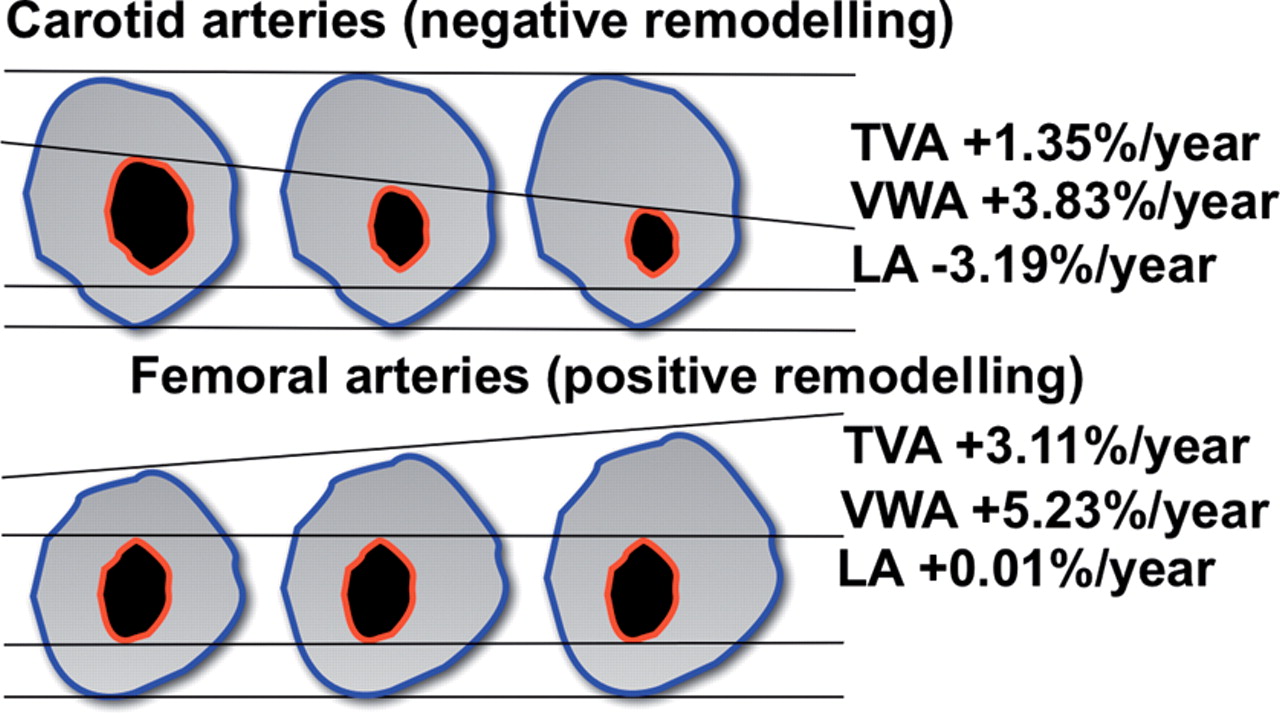
The atherosclerotic burden increased significantly in both carotid and femoral arteries. However, carotid plaque progression was associated with negative remodelling, whereas the increase in femoral plaque burden was compensated by positive remodelling. This finding could be related to anatomic and flow differences and/or to the distinct degree of obstruction in the two arterial territories.
Introduction
Recently, there has been an increasing interest in studies of non-coronary atherosclerosis. Determinants of this renewed interest are the perception that atherosclerosis represents a systemic disease with manifestations in multiple vascular beds and that the presence of peripheral vascular disease is one of the most formidable prognostic predictors of cardiovascular morbidity and mortality.1
Progression of atherosclerosis has been studied extensively post-mortem and in vivo in coronary arteries using invasive methods (e.g. angiography, intra-vascular ultrasound, and emerging non-invasive techniques). Although angiography remains the mainstay procedure for evaluation of flow-limiting stenosis in both coronary and peripheral artery diseases, in the clinical research field, there is increasing interest in non-invasive imaging techniques that assess not only the vascular lumen (‘luminogram’) but also the vessel wall and the plaque.2
High spatial resolution magnetic resonance imaging (HR-MRI) has been used to study human atherosclerotic lesions in several vascular beds, and its accuracy and reproducibility in measuring atherosclerotic plaques has been reported.3–6Ex vivo and in vivo studies in animals and in humans have clearly demonstrated the high potential of MRI in evaluating atherosclerotic plaques in different vascular territories non-invasively.7,8 In addition, MRI can safely assess the effects of drugs and/or mechanical treatments, such as the action of statins or balloon angioplasty.9,10 Few studies have simultaneously compared the natural course of atherosclerosis of two different vascular beds (carotid and aorta or carotid and coronary arteries),11 and to our knowledge, no previous prospective study using HR-MRI plaque imaging at the level of both carotid and femoral arteries has been conducted to quantify the evolution of atherosclerosis.11,12
In this prospective study, we aimed to evaluate both carotid and femoral levels intra-individually in patients with a high Framingham cardiovascular risk score using HR-MRI.
Methods
Study population
Patients were recruited from our outpatient vascular clinic, where they were evaluated for carotid and femoral artery diseases. Screening was performed using duplex ultrasound of the extracranial cerebral arteries. Patients were considered eligible for inclusion in the protocol if they presented with an asymptomatic <70% carotid artery stenosis. Patients were not eligible for the study if they had non-atherosclerotic occlusive disease, severe claustrophobic reactions or short-term life-threatening pathology (life expectancy <12 months), or were pregnant. Only patients who underwent the complete protocol with plaque HR-MRI of both carotid and femoral arteries at each time point (baseline, 1-, and 2-year follow-up) were considered for statistical analysis. The study complies with the Declaration of Helsinki, the local ethics committee approved the protocol, and the patients gave their informed consent.
Baseline examination included: medical history, cardiovascular examination, and laboratory analysis (haemoglobin, haematocrit, total white blood cells, platelets, creatinine, HbA1c-glycosylated haemoglobin, cholesterol profile, hs-CRP, homocysteine, and microalbuminuria) as well as blood sampling for potential evaluation of additional future markers and duplex ultrasound of the epiaortic arteries. All the patients were treated with standard medical care.
High-resolution magnetic resonance imaging
The MRI protocol included the completion of HR-MRI of both the carotid and femoral arteries at baseline and at 1- and 2-year follow-up, totalling six scans per patient. As specified by the study protocol, only patients who completed the entire 2-year follow-up, including the full HR-MRI examination of both carotid and femoral arteries, were considered for final evaluation. High spatial resolution magnetic resonance imaging scanning of the carotid and femoral arteries was performed as a separate investigation within a time frame of <2 weeks. A 1.5 T unit (Gyroscan Intera, release 11; Philips Medical Systems, Best, The Netherlands) with a gradient strength of 30 mT/m and a slew rate of 150 mT/m/ms was used.
For imaging of the carotid arteries, a bilateral, four channel, phased-array (receive only) coil (Machnet BV, TD Elde, The Netherlands) was carefully positioned at the level of the carotid bifurcation and used for all data collection. The protocol started with scout images and a two-dimensional (2D) time-of-flight (TOF) MR-angiography sequence to localize the carotid bifurcations. This was followed by a sagittal T1-weighted (T1w), double inversion recovery, fast spin echo (2IR-FSE) sequence at the level of the index common carotid artery bifurcation to allow precise localization of the bifurcation, plaque extension, and therefore reproducible planning of the subsequent MR images (Figure 1). The 2IR-FSE sequence allows nulling of the signal from the flowing blood and is known as blackblood MRI. Axial, 2D, ECG-triggered, 2IR-FSE sequences centred at the index carotid artery bifurcation using T1w, proton density-weighted (PDw), and T2-weighted (T2w) imaging sequences with spectral fat saturation were performed using the following parameters: slice thickness, 2 mm; number of slices, 12; acquired in-plane resolution, 0.63 × 0.63 mm (reconstructed 0.31 × 0.31 mm); NSA, 2; repetition time (TR), 1 RR interval for T1w and 3 RR for PDw and T2w; echo time (TE), 7, 12, and 50 ms for T1w, PDw, and T2w images, respectively. In addition, an axial 3D TOF sequence was acquired in the same position as the 2IR-TSE sequences with the following imaging parameters: number of slices, 12; slice thickness, 2 mm; acquired in-plane resolution, 0.63 × 0.63 mm (reconstructed 0.31 × 0.31 mm); NSA, 2; TR, 23; TE, 2.1; flip angle, 25°.
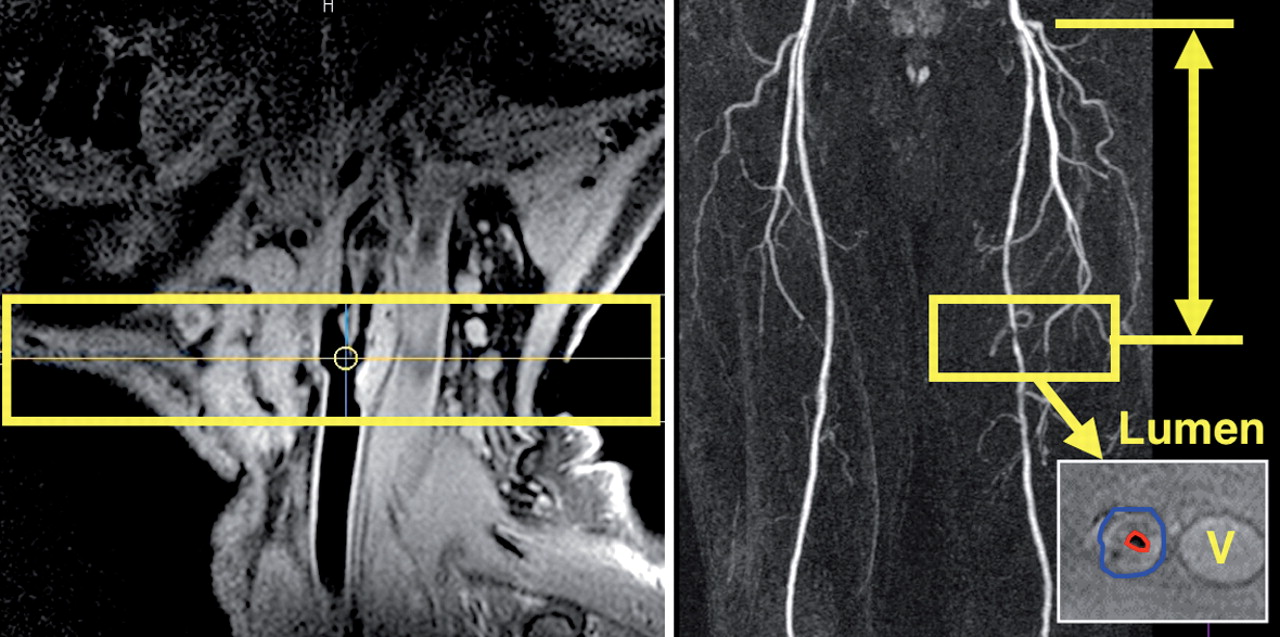
Magnetic resonance imaging method for serial plaque imaging. Left: sagittal high spatial resolution magnetic resonance imaging image at the level of the carotid bifurcation shows an extensive atherosclerotic plaque with positive remodelling of the internal and common carotid artery (T1-weighted, double inversion recovery). The yellow box indicates the positioning of subsequent axial high spatial resolution magnetic resonance imaging sequences. Right: magnetic resonance imaging method for serial plaque imaging at the femoral level. After localization of the stenosis of interest, a three-dimensional volume (yellow box), containing 10 contiguous cross-sectional images perpendicular to the lumen axis was acquired and carefully matched over time using measurements from anatomical landmarks (such as common femoral artery bifurcation). Manual tracing of vessel border (lumen in red and outer border in blue) was performed to quantify vessel dimensions (lower panel). Outer vessel border defined the total vessel area. V, Femoral vein.
Femoral artery MRI studies were performed in separate imaging sessions using a previously described imaging protocol.10 The MRI protocol consisted of three steps: (i) gradient echo (scout) series to localize anatomic structures; (ii) TOF MRI angiography to localize the stenotic lesion of interest and to define the precise location of the index stenosis by measuring the distance from femoral artery bifurcation to the lesion of interest, therefore allowing reproducible positioning of (iii) plaque imaging sequences in all follow-up studies (Figure 1). Three-dimensional T2w, PDw, T1w, ECG-triggered, 2IR-FSE sequences were used to acquire cross-sectional images of the vessel wall with the following parameters: slice thickness, 2.5 mm; number of slices, 10; acquired in-plane resolution, 0.35 × 0.42 mm (reconstructed 0.18 × 0.18 mm); NSA, 2; TR, 1 RR interval for T1w and 2–3 RR for PDw and T2w, respectively; TE, 9.4 ms for T1w and PDw and 40 ms for T2w images; echo train length was 6 for T1w and 24 for PDw and T2w images. Spectral suppression was used for black blood images (T1w, PDw, and T2w) to reduce signal from subcutaneous fat. Spatial presaturation slabs were used to eliminate aliasing resulting from the small field of view (90 × 90 mm). In order to obtain optimized signal-to-noise ratio, a small circular superficial receive-only coil (diameter 8 cm), centred at the region of interest, was used for all 2IR-FSE sequences. The index femoral lesions were located from the level of femoral bifurcation to the distal femoral artery. If no clear atherosclerotic lesion was detected on the TOF MRI angiography during the baseline study, high-resolution plaque imaging sequences were centred at the level of the common femoral artery bifurcation. The approximate duration of the MR study was 40–50 min for the carotid artery and 35–45 min for the femoral artery.
Duplex ultrasound imaging
A single experienced ultrasonographer performed all Duplex examinations with a 7 MHz linear-array transducer on a Sequoia 512 unit (Acuson Inc., Mountain View, CA, USA) at our outpatient vascular unit during the screening phase, at baseline, and at 1- and 2-year follow-up. The examination was performed with the patient in the supine position with the head resting on a support pillow for at least 15 min. Sites of examination included the key lesion, the common carotid artery, and the internal carotid artery. The study was started low in the neck by visualizing the common carotid artery along its longitudinal axis. The transducer was then moved towards the base of the skull to identify the carotid bulb and the internal and external carotid arteries. For carotid artery stenosis, estimation of obstruction was completed using B-mode evaluation in short and long axes as well as previously described semi-quantitative Doppler assessment.13–15
Image analysis
Magnetic resonance imaging studies were transferred from a PACS/RIS system (Philips Medical Systems) to a dedicated software program (GTVolume v.1.3 for Windows, GyroTools Ltd, Switzerland) used to analyse the morphometrics of the cross-sectional MR images with the aid of a touch screen device (pen display DTU-1931, Wacom Co. Ltd). Two trained reviewers (a radiologist with 8 years of experience in magnetic resonance plaque imaging and one research fellow with 1 year of experience) evaluated the images in consensus.
To further maximize co-registration among follow-up studies, meticulous alignment of the images was performed before final evaluation according to the level of the carotid bifurcation or of identical external anatomical landmarks (e.g. small veins on images of the femoral artery) as shown in Figure 2. At the carotid level, all matched images from the common to internal carotid artery present in each follow-up examination were used for further analysis.
Matching of magnetic resonance images at the level of the carotid artery over time. Matching of the axial magnetic resonance images from baseline to 2-year follow-up on the basis of reference anatomic landmarks, e.g. carotid bifurcation (arrowhead) allowed correct alignment of the slices.
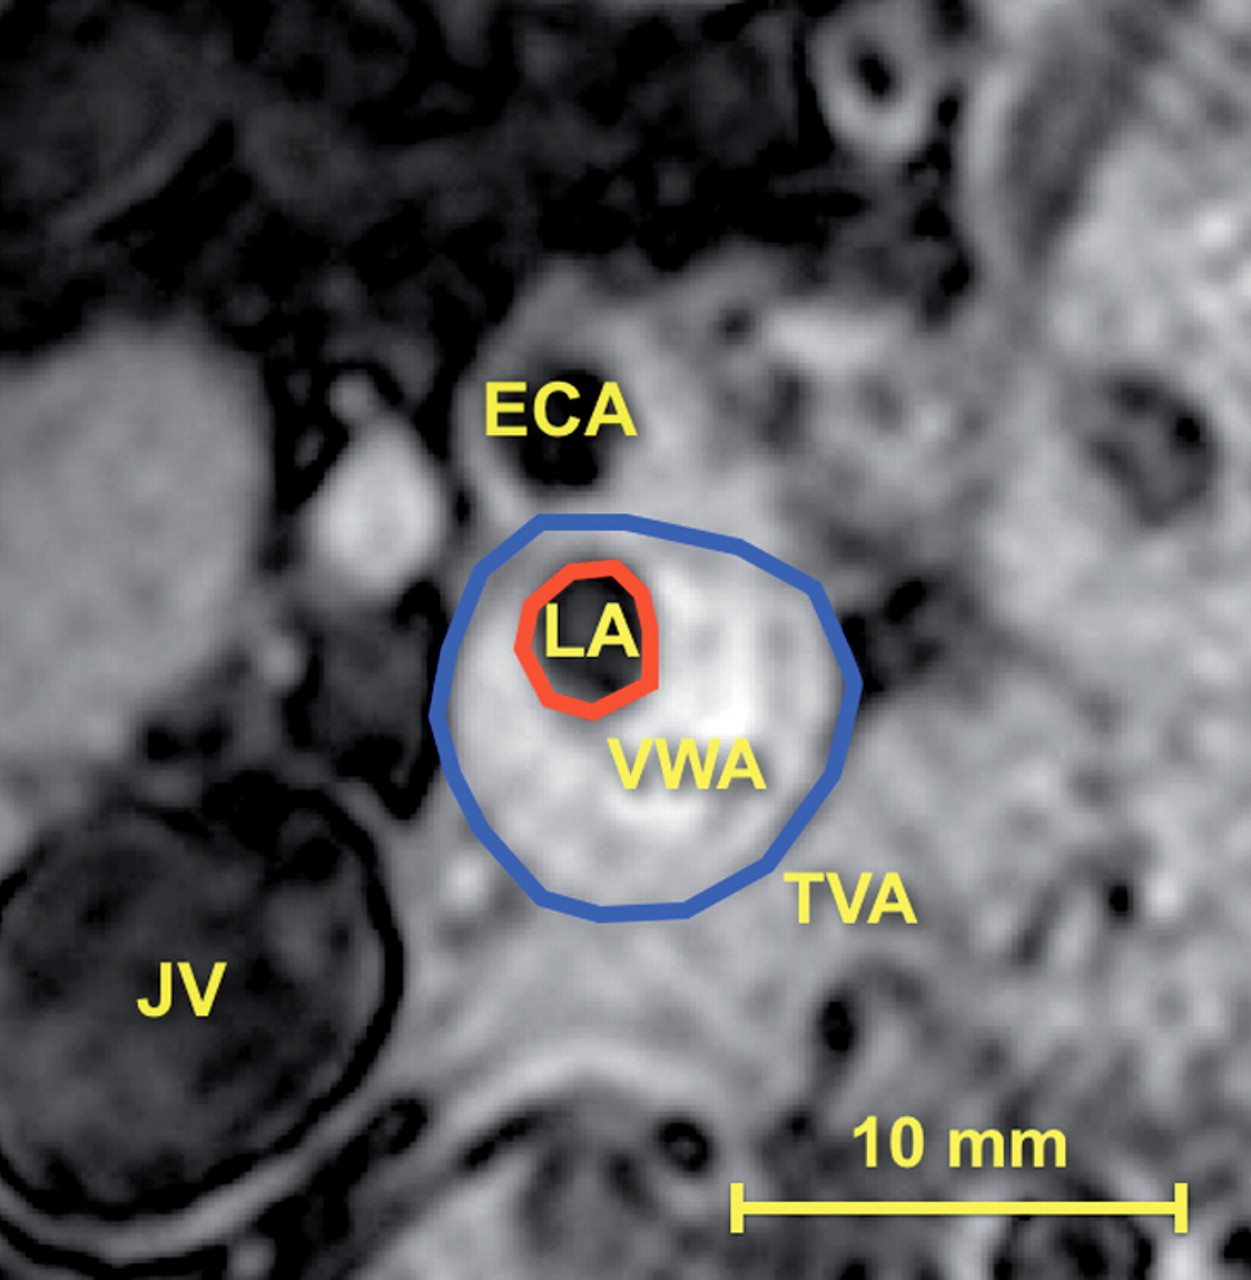
Luminal area (LA) was defined as the area encompassed by the inner boundary of the intimal surface. Total vessel area (TVA) was defined by the outer boundary of the vessel. Vessel wall area (VWA) was calculated by the software subtracting TVA from LA (VWA = TVA − LA). These parameters are outlined in Figure 3. Luminal area and TVA were assessed on T1w images; if image quality was not sufficient, T2w or PDw images were used instead.16 Images with poor quality were excluded from evaluation. A normalized wall index was then calculated (NWI = VWA/TVA). Inter-reader and intra-reader reproducibility were evaluated for 10 randomly selected patients at both carotid artery and femoral artery levels for a total of 20 segments. Intra-class correlation coefficient (ICC) for the agreement between two operators/two repeated measures were calculated with 95% confidence interval for the TVA, LA, and VWA.
Carotid artery tracing. Atheromatous plaque of the internal carotid artery: lumen area (LA, red line) and total vessel area (TVA, blue line) are manually outlined. Vessel wall area (VWA = TVA − LA) is calculated by the software. Also note the external carotid artery (ECA) and the right jugular vein (JV).
Data management and statistical analysis
Summary statistics are shown as the mean of the values ± SD. The means of morphometric variables are intended as a sum of all areas divided by the number of slices summarized across all subjects. Two intermediate missing values were replaced by the mean of extremes. Only data from location-matched images were considered for analysis. Changes are presented as mean evolution between visits and as annualized rates both for absolute and per cent values. Evolutions between visits were analysed using analysis of variance for repeated measures and the comparison of annual change to zero using one sample t-test. Values were tested for normal distribution. Statistical significance was defined as a value of P<0.05, two-tailed. All graphs and calculations were performed using SPSS 18.0 and GraphPad Prism 5.0. Data management was performed with Filemaker Pro v10.0v3.
Results
Forty-five patients screened by Duplex ultrasound between June 2006 and March 2008 were considered for MRI plaque imaging. Thirty patients underwent the complete MRI protocol of both carotid and femoral plaque at baseline and at 1- and 2-year follow-up. In total, this led to 178 MRI studies (one patient missed at the 1-year carotid and femoral follow-up visit). Five patients chose not to continue with the follow-up studies (two of them presented with claustrophobia), four patients had to be excluded because of limited image quality, three patients died, two patients underwent stenting because of plaque progression (one at the carotid and one at the femoral levels), and one patient could not complete the follow-up due to pacemaker placement.
Clinical data
The majority of patients were more than 55 years old and presented mild-to-moderate increase in arterial blood pressure, despite pharmacological treatment. Half presented with a history of coronary artery disease (CAD), more than 65% were smokers or ex-smokers, and one-third of patients suffered from diabetes mellitus. Hyperlipidaemia was present in >90% of the patients, and despite antilipidaemic drugs, the mean cholesterol LDL level at baseline was 2.9 mmol/L (±0.96) and 2.44 mmol/L (±0.87) at the second year (P = 0.03). Sixty-eight per cent of the patients were on statin therapy for more than 2 years. Other baseline characteristics, medication, and laboratory results of the population were stable during follow-up and are shown in Table 1.
Clinical data of the analysed population (n = 30): demographics, medications, medical history, and laboratory results
| Demographics and medications | Mean ± SD or % | Medical history and laboratory | Mean ± SD or % |
|---|---|---|---|
| Age (years) | 68.3 ± 8.1 | History of CAD (%) | 46.7 |
| Female sex (%) | 30.0 | Family history of CAD (%) | 30.0 |
| Height (cm) | 167.1 ± 7.8 | Smokers (%) | 26.7 |
| Weight (kg) | 74.9 ± 10.7 | Ex-smokers (%) | 40.0 |
| Body mass index (kg/m2) | 26.7 ± 2.6 | Smoke-free (years) | 11.3 ± 11.2 |
| Pulse (b.p.m) | 64.4 ± 11.9 | Hypertension (%) | 86.7 |
| BP systolic (mmHg) | 143.4 ± 20.5 | History of heart failure (%) | 3.3 |
| BP diastolic (mmHg) | 78.1 ± 8.4 | Diabetes mellitus (%) | 30.0 |
| Claudicatio (%) | 33.3 | ||
| Anticoagulation (%) | 3.3 | Hyperlipidaemia (%) | 96.7 |
| Aspirin (%) | 80.0 | COPD (%) | 3.3 |
| Clopidogrel or others (%) | 56.7 | Other medical relevant conditions (%) | 63.3 |
| ACE inhibitor (%) | 33.3 | Framingham 10 years CVD score (%) | 29.5 |
| Angiotensin receptor blocker (%) | 30.0 | ||
| β-Blocker (%) | 60.0 | ||
| Calcium antagonist (%) | 36.7 | Creatinine (μmol/L) | 111.3 ± 50.0 |
| Nitrates (%) | 3.3 | Cockcroft–Gault clearance (mL/min) | 63.6 ± 22.4 |
| Oral antidiabetics (%) BL | 26.7 | Microalbuminuria (mg/L)* | 23.9 (17.5–202.0) |
| Insulin (%) | 13.3 | Cholesterol (mmol/L) | 4.8 ± 1.2 |
| Hypolipdaemic, statin (%) | 86.7 | LDL (mmol/L) | 2.9 ± 0.9 |
| Time since beginning (years) | 3.8 ± 3.53 | HDL (mmol/L) | 1.4 ± 0.4 |
| Atorvastatin (%) | 56.7 | Triglycerides (mmol/L)* | 1.6 (1.2–2.5) |
| Simvastatin (%) | 13.3 | A1c haemoglobin (DCCT) | 6.3 ± 1.5 |
| Pravastatine (%) | 10.0 | Haemoglobin (g/dL) | 14.2 ± 1.6 |
| Fluvastatin (%) | 6.7 | hs-PCR (mg/L)* | 1.9 (1.0–2.3) |
| Hypolipdaemic, other than statin (%) | 20.0 | Homocysteine (μmol/L) | 17.1 ± 7.3 |
*Median, first, and third inter-quartile value for data with non-normal distribution.
High spatial resolution magnetic resonance imaging
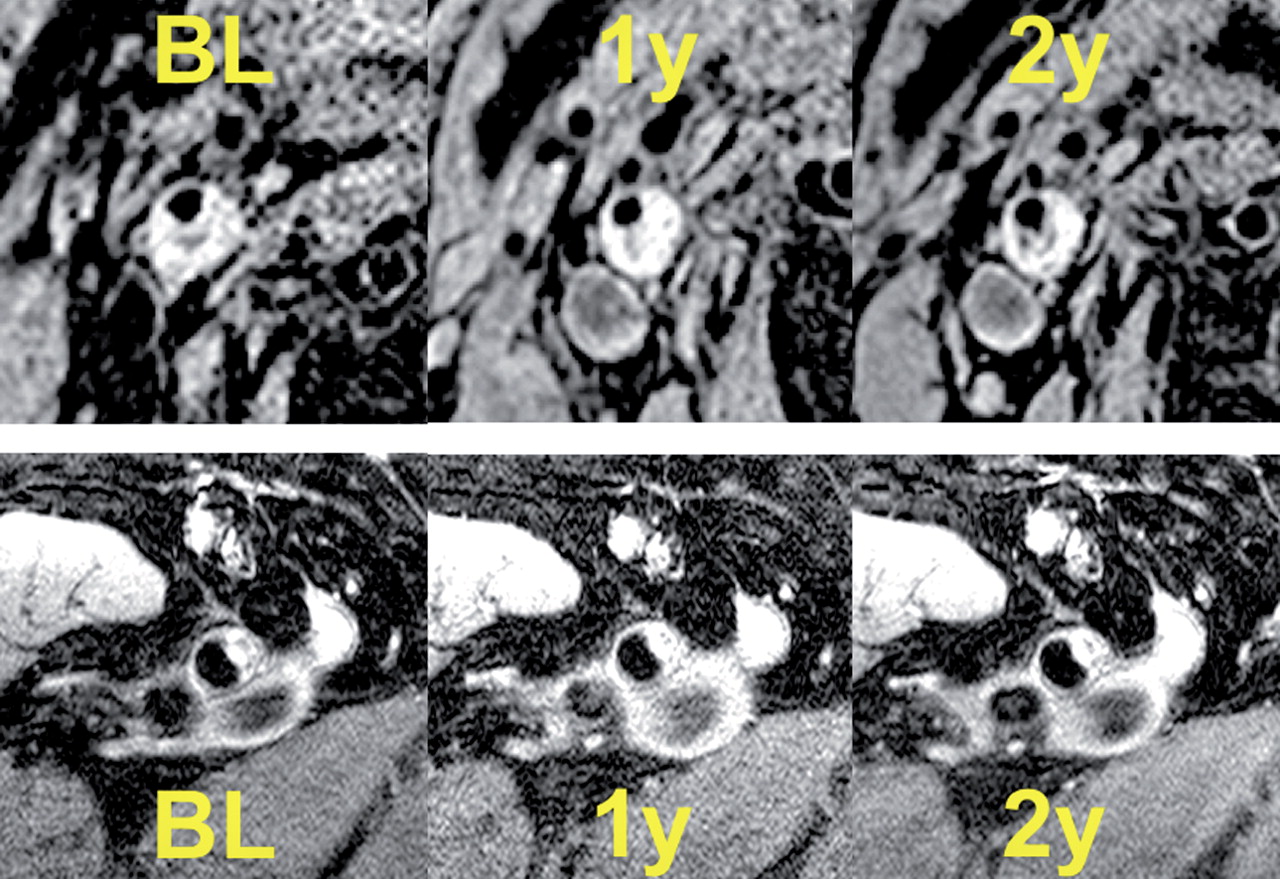
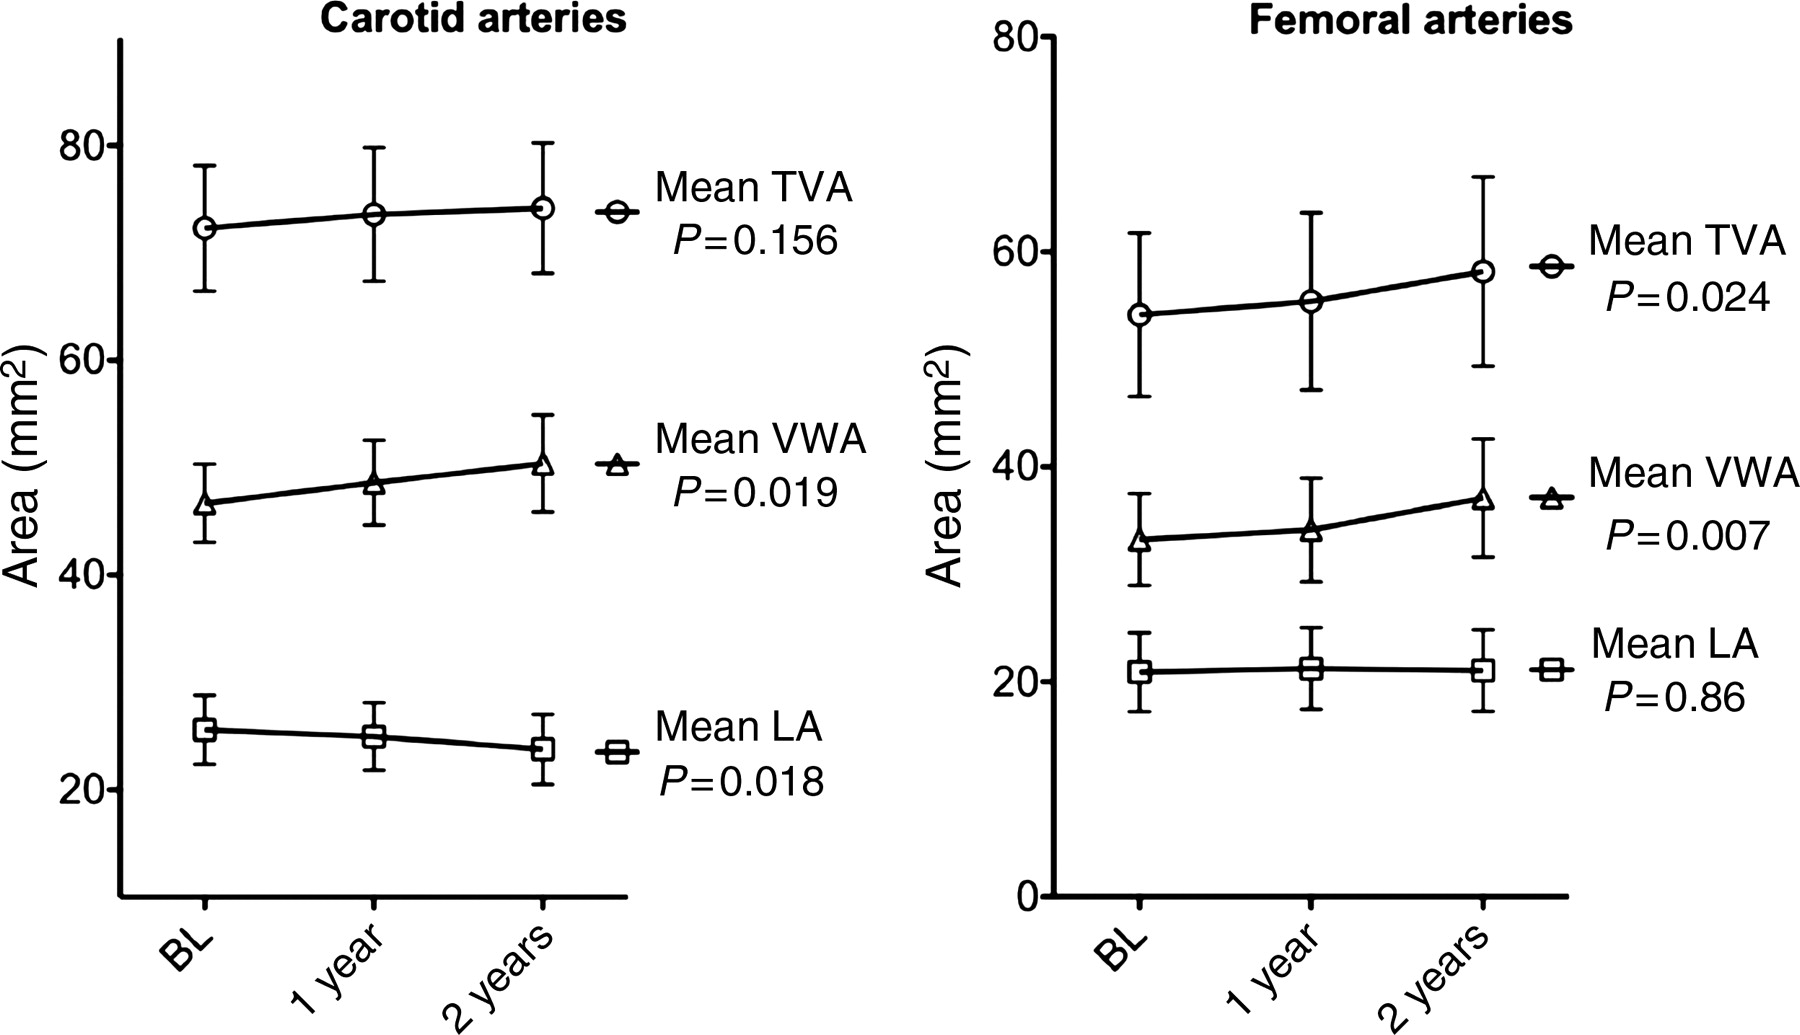
A total of 1068 HR-MRI cross-sectional images of the carotid arteries (360 at BL, 348 at 1 year, and 360 at 2 years) and 890 cross-sections at the level of the femoral arteries (300 at BL, 290 at 1 year, and 300 at 2 years) were evaluated. Mean follow-up time was 2.18 (±0.19) years at the carotid level and 2.16 (±0.18) years at the femoral level. Mean interval time between carotid and femoral HR-MRI was 9.3 days (±31.7). Progression during the 2-year follow-up is shown in Figure 4. At the carotid level, LA decreased (−3.19%/year, P = 0.018) while VWA increased (+3.83%/year, P = 0.019) and TVA remained unchanged. At the femoral level, LA remained unchanged, while VWA and TVA increased (+5.23%/year and +3.11%/year, both P < 0.05). Normalized wall index increased for both the carotid (+2.28%/year, P = 0.01) and femoral (+1.8/year, P = 0.033) arteries. The detailed data of LA, VWA, and TVA as assessed by HR-MRI are provided in Table 2. Figure 5 shows an example of HR-MRI cross-sections in the same patient at the level of the carotid and femoral arteries at baseline and during follow-up. The distinct remodelling process is emphasized in the schematic representation (Figure 6). Inter-observer ICCs of TVA, LA, and VWA were, respectively, 0.99 [95% confidence interval (CI): 0.96–0.99], 0.97 (0.93–0.98), and 0.97 (95% CI: 0.91–0.98) and intra-observer ICCs were 0.98 (95% CI: 0.96–0.99), 0.97 (95% CI: 0.94–0.99), and 0.96 (95% CI: 0.90–0.98).
High spatial resolution magnetic resonance imaging (morphologic values) and duplex results (stenotic degree) at the carotid level and (morphologic values) at the femoral level
| Baseline ± 1 SD | First visit ± 1 SD | Second visit ± 1 SD | P-value | Δ/year abs ± 1 SD | Δ/year % ± 1 SD | P-value | |
|---|---|---|---|---|---|---|---|
| Means (data based on matched locations) | ANOVA | t-test | |||||
| Carotid artery (n = 30) | |||||||
| Lumen area (mm2) | 25.61 ± 8.59 | 24.97 ± 8.42 | 23.78 ± 8.74 | 0.018 | −0.85 ± 1.83 | −3.19 ± 7.21 | 0.017 |
| Vessel wall area (mm2) | 46.69 ± 9.75 | 48.62 ± 10.55 | 50.39 ± 12.12 | 0.019 | 1.69 ± 3.55 | 3.83 ± 8.39 | 0.014 |
| Total vessel area (mm2) | 72.29 ± 15.65 | 73.59 ± 16.69 | 74.17 ± 16.28 | 0.156 | 0.88 ± 2.73 | 1.35 ± 4.24 | 0.089 |
| Normalized wall index | 0.65 ± 0.06 | 0.66 ± 0.06 | 0.68 ± 0.08 | 0.010 | 0.01 ± 0.03 | 2.28 ± 4.49 | 0.01 |
| Stenotic degree at duplex (%) | 49.0 ± 12.1 | 51.5 ± 12.9 | 55.7 ± 14.8 | <0.001 | 0.04 ± 0.05 | 0.001 | |
| Femoral artery (n = 30) | |||||||
| Lumen area (mm2) | 20.91 ± 9.81 | 21.25 ± 10.16 | 21.06 ± 10.14 | 0.860 | 0.03 ± 1.69 | 0.01 ± 8.31 | 0.926 |
| Vessel wall area (mm2) | 33.23 ± 11.44 | 34.15 ± 12.91 | 37.11 ± 14.72 | 0.007 | 1.80 ± 3.29 | 5.23 ± 9.53 | 0.005 |
| Total vessel area (mm2) | 54.15 ± 20.37 | 55.40 ± 22.04 | 58.17 ± 23.56 | 0.024 | 1.83 ± 3.80 | 3.11 ± 7.32 | 0.013 |
| Normalized wall index | 0.62 ± 0.07 | 0.63 ± 0.07 | 0.64 ± 0.07 | 0.033 | 0.01 ± 0.02 | 1.80 ± 3.68 | 0.021 |
P-values from one-way ANOVA (repeated measures) for the mean values and t-test of the annualized (Δ/year) absolute values.

Line graphs of atherosclerotic progression. Evolution of mean lumen area (LA), vessel wall area (VWA), and total vessel area (TVA) at the carotid (left) and femoral (right) levels; plots with error bars (95% confidence interval).
Example magnetic resonance images of both territories. Top: axial magnetic resonance images (T1-weighted, double inversion recovery) at the level of the internal carotid artery at BL; 1- and 2-year follow-up shows a negative remodelling with moderate luminal narrowing. Bottom: axial oblique plane high spatial resolution magnetic resonance imaging images of the common femoral artery (three-dimensional-T1-weighted-double inversion recovery) of the same patient showing eccentric atherosclerotic remodelling at baseline and at 1- and 2-year follow-up.
Schematic representation of remodelling. Remodelling at the level of the carotid and femoral arteries has been emphasized in order to show the evolution.
Duplex
Duplex ultrasound of the index carotid arteries (Table 2) revealed progression of the degree of stenosis at the carotid level of +3.3%/year (±5.3%). The degree of arterial obstruction at baseline in the two vascular territories was different: at the carotid arteries, 53% of patients had a stenosis of >50%, whereas at the femoral level, only 22% of the patients had a stenosis of >50%.
Clinical follow-up and morphometric values
The Framingham general cardiovascular disease 10-year risk score at baseline was 29.5%. In the 45 patients who were initially included, we observed three deaths, seven cerebrovascular events, and seven acute coronary syndromes. There was no statistically significant correlation between the morphometric MRI parameters and the occurrence of clinical cardiovascular events.
Discussion
Our in vivo prospective study on the natural history of atherosclerosis progression using serial high-resolution magnetic resonance imaging indicates that the atherosclerotic burden increases in both the carotid and femoral arteries. However, atherosclerosis presents a distinct intra-individual pattern of progression in the two arterial territories, with a negative remodelling at the level of the obstructed carotid artery and a positive remodelling at the level of the femoral arteries. To our knowledge, this is the first prospective study that systematically assessed progression of atherosclerotic burden intra-individually by HR-MRI at both the carotid and peripheral levels on a yearly basis. The results showed an increase in the mean VWA (+3.83%/year) at the level of the carotid arteries and a reduction in lumen area (−3.19%/year), despite standard medical care (Table 1), whereas at the femoral level, the increase in VWA (+5.23%/year) was not accompanied by a decrease in the lumen area (Figures 4, 5 and 6). This distinct pattern of vascular remodelling in two different vascular beds within the same patient could have several explanations. The observed differences between the two territories in our study may be related to anatomic and flow differences, such as vessel dimensions, tortuosity, bifurcation, and diverse flow conditions (high and low resistance flows at the femoral and carotid levels, different streamlines, and shear stress). Conversely, the different remodelling behaviours in our patients in the two territories cannot be related to differences in medical therapy, risk factors, or genetic profile because biological differences were excluded by our study design, with intra-individual comparison of two different vascular territories by HR-MRI. Another plausible explanation for the different remodelling patterns is the distinct degree of obstruction at the two vascular locations. This explanation is in accordance with the Glagov paradigm.17 Our patients presented a more advanced degree of obstruction at the level of the carotid arteries, and consistent with Glagov, the VWA increased while the LA decreased. Conversely, at the level of the femoral arteries, with a lesser degree of obstruction of the vessel wall, the progression of the atherosclerotic plaque continued to underlie a positive remodelling with a significant increase in the VWA albeit without a concomitant increase in the obstruction.
Hayashi et al.11 have recently reported retrospective data of patients who eventually underwent HR-MRI at the level of the thoracic-abdominal aorta and carotid arteries, indicating a possible distinct progression pattern in the various territories. In contrast, our prospective data definitely point to the differential behaviour of atherosclerosis according to its localization and stage.
At the level of the carotid arteries, our results are in agreement with the recent data of Saam et al.18 Surprisingly, we found a positive remodelling with augmentation of VWA and preservation of the LA at the level of the femoral arteries. This is in contrast with the post-mortem findings of Pasterkamp et al.19 and of Li et al.20 using HR-MRI, who both found that the constrictive remodelling pattern was more prevalent at the level of the peripheral arteries than at the level of the coronary and carotid arteries. This can partially be explained by the high degree of femoropopliteal obstruction among their patients when compared with our cohort, in which only 22% of patients had a femoral obstruction >50%.
Carotid and peripheral arteries—like the coronary arteries—may undergo circumferential changes in response to atherosclerotic lesion formation.17,19 Arterial remodelling remains a major determinant of luminal narrowing in all vascular beds; a deterministic mechanism for maintaining patency of the lumen in the presence of atherosclerosis. Conversely, there is evidence that arteries undergoing an important positive remodelling harbour a high risk of complications and are more prone to plaque complications, such as plaque rupture with exposure of the lipid-rich core or plaque haemorrhage. Although our project was not focused on acute ischaemic cerebral complications, this underlines the relevance of plaque composition and the potential of HR-MRI in detecting plaque complication as recently emphasized.21
The prevalence and clinical presentation of expansively remodelled lesions may differ depending on location within the arterial tree, as indicated not only by our results but also according to the location along the vessel. High spatial resolution magnetic resonance imaging constitutes an ideal tool to study acute and chronic remodelling at the level of the carotid and lower limb arteries in vivo and non-invasively. Using the same technique, we recently reported on acute and long-term ‘in vivo’ vascular effects in patients undergoing endovascular therapy of the lower limb arteries.10,22
Study limitations
The relatively small cohort of patients in this study does not allow extrapolation of our results to a larger cohort and this is the main limitation of the study. We are aware that the observations in our study refer to mean values of the HR-MRI-derived parameters obtained from selected arterial segments. Therefore, the results may neither reflect systemic remodelling nor regional effects in the same vessel segment.
There was a trend to progression of TVA at the level of the carotid artery, although not significant (P = 0.089), the power of the test being only 55%. In order to show a significant increase with a power of 80%, 60 patients would have been necessary, a number of patients far beyond the possibilities of the present very demanding protocol.
Our study design with recruitment of patients based primarily on asymptomatic <70% carotid stenosis led to the fact that the degree of stenosis was more advanced in the carotid than in the femoral arteries which may contribute to the distinct progression of atherosclerosis between these vascular territories.
The LDL cholesterol levels at entry were higher than those recommended for secondary prevention in CAD and approximately two-thirds of patients were on statins for more than 2 years at the time they were included in the study: these two factors could explain the lack of regression of atherosclerosis as found in previous studies.23,24
The relatively high number of patients (15 of 45) that dropped-out of the study represents another limitation; however, this appears to be in accordance with previous studies.25
Our study focused on progression of atherosclerosis based on measurements of lumen and VWA, but we did not assess plaque components since adequate image quality is mandatory in all imaging sequences in order to perform reliable analysis of plaque composition. This would have led to further drop-out of a significant number of studies reducing thereby furthermore the number of patients with a complete set of follow-up studies and therefore meaningful statistical evaluation would have likely become impossible. In addition, 3D volume imaging acquisition at the level of the carotid arteries was not performed because it was not feasible at that time.
Conclusions
Despite a standard medical care, the atherosclerotic burden increases significantly and similarly in both carotid and femoral arteries. However, carotid arteries show a pattern of remodelling that is distinct from that of femoral arteries. This finding, which needs to be confirmed in further studies, could be related to anatomic and flow differences between the two arterial territories and/or to the different degrees of obstruction.
Funding
This study has been supported by an academic grant of the Swiss Heart Foundation (R.W.), from the Swiss National Research Foundation (research grant Number SNF-320000-109905, R.C. and A.G.) and from the Dr Ettore Balli's Foundation, Switzerland (N.B.).
Conflict of interest: none declared.
Acknowledgements
We are grateful for technical assistance from Markus Scheidegger, PhD; Philips Medical Systems (Switzerland); Michael Wyss, MS, Institute for Biomedical Engineering, ETH (Zurich, Switzerland).
References
Author notes
This paper was guest edited by Jürg Schwitter, University Hospital Lausanne, Switzerland
These authors contributed equally to this work.

