


Abstract
The objective of the present analysis was to systematically examine the effect of intracoronary bone marrow cell (BMC) therapy on left ventricular (LV) function after ST-segment elevation myocardial infarction in various subgroups of patients by performing a collaborative meta-analysis of randomized controlled trials.
We identified all randomized controlled trials comparing intracoronary BMC infusion as treatment for ST-segment elevation myocardial infarction. We contacted the principal investigator for each participating trial to provide summary data with regard to different pre-specified subgroups [age, diabetes mellitus, time from symptoms to percutaneous coronary intervention, infarct-related artery, LV end-diastolic volume index (EDVI), LV ejection fraction (EF), infarct size, presence of microvascular obstruction, timing of cell infusion, and injected cell number] and three different endpoints [change in LVEF, LVEDVI, and LV end-systolic volume index (ESVI)].
Data from 16 studies were combined including 1641 patients (984 cell therapy, 657 controls). The absolute improvement in LVEF was greater among BMC-treated patients compared with controls: [2.55% increase, 95% confidence interval (CI) 1.83–3.26, P < 0.001]. Cell therapy significantly reduced LVEDVI and LVESVI (−3.17 mL/m², 95% CI: −4.86 to −1.47, P < 0.001; −2.60 mL/m², 95% CI −3.84 to −1.35, P < 0.001, respectively). Treatment benefit in terms of LVEF improvement was more pronounced in younger patients (age <55, 3.38%, 95% CI: 2.36–4.39) compared with older patients (age ≥55 years, 1.77%, 95% CI: 0.80–2.74, P = 0.03). This heterogeneity in treatment effect was also observed with respect to the reduction in LVEDVI and LVESVI. Moreover, patients with baseline LVEF <40% derived more benefit from intracoronary BMC therapy. LVEF improvement was 5.30%, 95% CI: 4.27–6.33 in patients with LVEF <40% compared with 1.45%, 95% CI: 0.60 to 2.31 in LVEF ≥40%, P < 0.001. No clear interaction was observed between other subgroups and outcomes.
Intracoronary BMC infusion is associated with improvement of LV function and remodelling in patients after ST-segment elevation myocardial infarction. Younger patients and patients with a more severely depressed LVEF at baseline derived most benefit from this adjunctive therapy.
Introduction
Previous meta-analyses of randomized trials have shown that intracoronary bone marrow cell (BMC) infusion in ST-segment elevation myocardial infarction (STEMI) patients has moderate positive results on the recovery of left ventricular (LV) function.1,2 Based on more detailed analyses from the individual trials, certain subgroups seem to have more benefit.
In some studies, patients with long delay from onset symptoms to revascularization, larger myocardial infarction (anterior myocardial infarction) and reduced baseline LV ejection fraction (EF) were more likely to benefit from BMC therapy.3–5 Regarding microvascular obstruction (MVO), the subgroup effect remains unclear since two studies reported different outcomes of BMC therapy in this patients group.6,7 Furthermore, ageing and risk factors for coronary artery disease affect the functional activity of endogenous stem and progenitor cells in experimental models, thereby potentially limiting the therapeutic potential of these cells.8
However, the individual trials have not been large enough to explore outcomes reliably within such subgroups. Identifying the characteristics of the patients who will ultimately benefit from cell therapy is essential to allow for efficient translation of this novel therapy to clinical practice. Therefore, the aim of this collaboration was to assess the effects of intracoronary BMC on LVEF, LV end-diastolic volume index (EDVI) and LV end-systolic volume index (ESVI) in various subgroups of STEMI patients based on pooled patient data.
Methods
Data sources and study selection
We performed a computerized literature search from 1980 to February 2013 of the Pubmed, Embase, Cochrane database, the Current Controlled Trials Register and KoreaMed, IndMed and LILACS by using search terms that included ‘‘bone marrow cells’,“ “stem cell’’, ‘‘precursor cell’’, ‘‘progenitor cell’’, ‘‘myocardial ischaemia’’, ‘‘myocardial infarction”,‘‘ischaemic heart disease’’, ‘‘coronary heart disease’’, and ‘‘heart failure’’ (see Supplementary material online, Appendix S1). Only English language publications were selected. Additionally, we manually searched the conference abstracts of the American Heart Association, American College of Cardiology, European Society of Cardiology, and Transcatheter Cardiovascular Therapeutics to identify additional unpublished studies. Finally, the bibliographies of identified studies and relevant review articles were screened for potentially suitable studies.
We included a study if: (i) it was a randomized, controlled trial; (ii) patients were included with a clinical diagnosis of STEMI, treated with percutaneous coronary intervention (PCI); (iii) a single intracoronary infusion of autologous BMC (irrespective of the type and number of isolated cells) within 1 month after STEMI was compared with a control arm not receiving BMC (e.g. infusion of control media or standard treatment). Studies were excluded if: (i) there were <30 participants in the cell therapy arm; (ii) follow-up was <3 months; (iii) BMCs were cultured in vitro for longer than 1 day prior to intracoronary infusion, or (iv) granulocyte colony-stimulating factor or macrophage colony-stimulating factor was administrated as co-intervention.
Study identification was done by two independent reviewers and disagreement was resolved by a third reviewer. A total of 26 randomized clinical trials were identified through literature search (Figure 1 and see Supplementary material online, Appendix S2). Out of these 26 studies, 16 had a cell therapy arm of 30 patients or more. Eventually, these 16 studies 5–7,9–21 all agreed to participate in this collaborative overview and meta-analysis. They provided the requested data, and vouched for the correctness of the data.
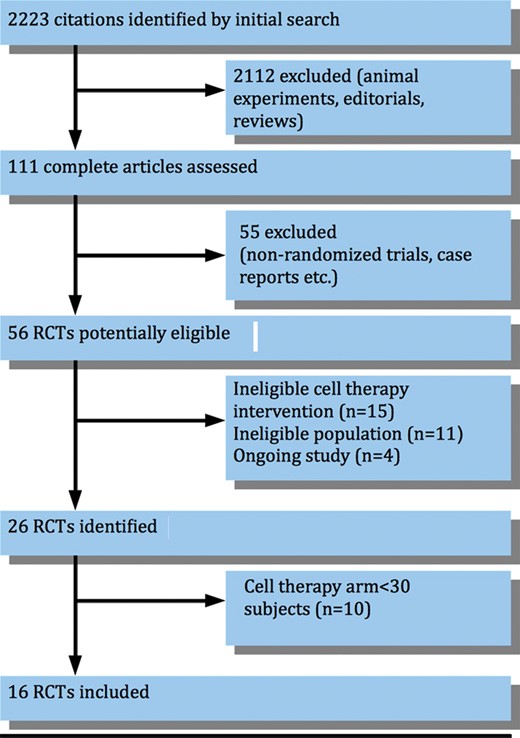
Flow diagram of studies included in this meta-analysis. RCTs, randomized controlled trials. See Supplementary material online, Appendix S2 for a list of identified studies.
Endpoints, subgroups, and data assembly
The following three endpoints were investigated in the analysis: change in LVEF (in %), LVESVI (in mL/m²), and LVEDVI (in mL/m²) from baseline to follow-up. The preferred follow-up duration was 6 months. If not available, outcome at 3 or 4 months was used.
The following subgroups were defined by the baseline characteristics : (i) age <55 years/≥55 years, (ii) diabetes mellitus yes/no, (iii) symptoms to PCI time <6 h/≥6 h, (iv) infarct-related artery left anterior descending artery/right coronary artery or left circumflex artery, (v) baseline LVEDVI <100 mL/m²/≥100 mL/m², (vi) baseline LVEF <40%/≥40%, (vii) infarct size <20 g/≥20 g on magnetic resonance imaging (MRI), and (viii) MVO presence/absence on MRI. Furthermore, we requested data on (ix) time from primary PCI to cell infusion <7 days/≥7 days and (x) total number of injected mononuclear BMC < 108/≥108. The subgroups cut-off points were chosen based on the results of the previous cell therapy studies. Lastly, we compared two trial characteristics, namely type of imaging modality (MRI vs. other) and study design (double-blinded randomized controlled trials compared with open label studies).
The principal investigator of each identified trial provided summary data (number of patients and mean ± standard deviation) of the three different endpoints and 10 different pre-specified subgroups.
For the current analysis, subgroups and baseline timing of the measurement of LV function were defined as reported in each of the individual trials. When several methods were used for outcome assessment, MRI data were preferentially included in the analysis, followed by single photon emission computed tomography, echocardiography and LV angiography.
Statistical analysis
An overall meta-analysis was performed of the change in the three outcomes (LVEF, LVESVI, and LVEDVI), based on random-effects models using the method described by DerSimonian and Laird 22. Results are presented as absolute changes from baseline to follow-up, with their 95% confidence intervals (CIs), per subgroup. Differences in treatment effects between subgroups were tested with the heterogeneity test from Review Manager version 5.0. This test is based on the notion of performing a test for heterogeneity across subgroups rather than across studies. It measures the extent of inconsistency across the subgroups' results, and is interpreted as approximately the proportion of total variation in subgroup estimates that is due to genuine variation across subgroups rather than sampling error. For the subgroup based on infarct size on MRI, the analysis was restricted to those six trials that had these data.7,11,13,15,16,21,23 The presence or absence of MVO on MRI was available only in seven trials.6,7,11,15–17,19,21 For the analysis regarding time from primary PCI to cell infusion <7 days/≥7 days and total number of injected mononuclear BMC < 108/≥108, the specific BMC therapy group was compared with controls in which sham infusion was performed. In trials where no sham infusion was performed, the comparator was compared with the entire control group. In the analysis of total number of injected mononuclear BMC < 108/≥108, we excluded three studies which used nucleated BMC or selected CD34+/CXCR4+ cells.5,20,21 Subgroup analyses were not adjusted for multiple testing.
Results
The participating trials randomized 1641 patients to intracoronary cell therapy (n = 984) or standard therapy (n = 657). Characteristics of the studies included in this review are listed in Table 1. The mean age across studies ranged from 50 to 61 years. Six studies included only patients with an anterior myocardial infarction. All STEMI patients were treated with primary PCI, except in the FINCELL study where patients were treated with thrombolysis first and later with PCI and cell infusion.12 Six studies performed BMC aspiration in the control group and seven studies performed sham infusion. Three trials did not infuse mononuclear BMCs but selected CD34+/ CXCR4+ cells or nucleated BMC, respectively.5,20,21 Methodological quality assessment of included studies is available in see Supplementary material online, Appendix S3. Trials fulfilled our markers of validity.
Characteristics of individual studies included in this review
| Author (year) | N | BMC vs. control | Mean age (years) | Mean Baseline LVEF (%) | Days from onset STEMI to BMC infusion | BMC aspiration/Sham infusion in control arm | Cell type | Number of injected cells (x108) | Volume bone marrow aspiration (mL) | Imaging modality for endpoint assessment | Days from STEMI to baseline LVEF assessment | Core lab assessment of imaging endpoint | Follow-up (months) |
|---|---|---|---|---|---|---|---|---|---|---|---|---|---|
| Cao et al. (2009) | 86 | 1:1 | 51 | Tx) 41 ± 3 | 7 | No/Yes | MN BMC | 0.5 ± 0.1 | ∼40 | 2D-TTE | 7 | No | 6 |
| C) 41 ± 3 | |||||||||||||
| Grajek et al. (2010) | 45 | 2:1 | 50 | Tx) 45 ± 10 | 4–6 | No/No | MN BMC | 4.1 ± 1.8 | 80 ± 30 | EF-RNV | 4–6 | No | 6 |
| C) 43 ± 7 | |||||||||||||
| Hirsch et al. (2010) | 134 | 1:1 | 56 | Tx) 44 ± 9 | 3–7 | No/No | MN BMC | 3.0 ± 1.6 | ∼60 | MRI | 3 (2–4) | Yes | 4 |
| C) 42 ± 8 | |||||||||||||
| Huikuri et al. (2008) | 80 | 1:1 | 59 | Tx) 59 ± 11 | 3 ± 2 | Yes/Yes | MN BMC | 4.0 ± 2.0 | ∼80 | LV Angio (biplane) | During PCI | Yes | 6 |
| C) 62 ± 12 | |||||||||||||
| Janssens et al. (2006) | 67 | 1:1 | 57 | Tx) 49 ± 7 | Within 1 day | Yes/Yes | MN BMC | 3.0 ± 1.3 | 130 ± 22 | MRI | 4 (3–5) | No | 4 |
| C) 47 ± 8 | |||||||||||||
| Lunde et al. (2006) | 100 | 1:1 | 57 | Tx) 55 ± 14 | 4–8 | No/No | MN BMC | 0.7 (0.5–1.3) | ∼50 | MRI | 19 ± 4 | No | 6 |
| C) 54 ± 12 | |||||||||||||
| Plewka et al. (2009) | 60 | 2:1 | 56 | Tx) 35 ± 6 | 7 ± 2 | No/No | MN BMC | 1.4 ± 0.5 | ∼100 | 2D-TTE | 3 | No | 6 |
| C) 33 ± 7 | |||||||||||||
| Roncalli et al. (2010) | 101 | 1:1 | 56 | Tx) 37 ± 10 | 9 ± 1 | No/No | MN BMC | 1.0 ± 0.09 | ∼50 | MRI | 7 ± 2 | Yes | 3 |
| C) 39 ± 9 | |||||||||||||
| Schachinger et al. (2006) | 204 | 1:1 | 56 | Tx) 48 ± 9 | 4 ± 1 | Yes / Yes | MN BMC | 2.4 ± 1.7 | ∼50 | LV angio (biplane) | 4 ± 1 | Yes | 4 |
| C) 47 ± 10 | |||||||||||||
| Sürder et al. (2013) | 200 | 2:1 | 58 | Tx) 36 ± 10 | 5–7 | No/No | MN BMC | 1.5 ± 1.2 | 68 ± 15 | MRI | 6 (4 –8) | Yes | 4 |
| C) 40 ± 10 | 21–28 | ||||||||||||
| Tendera et al. (2009) | 200 | 2:1 | 57 | Tx) 40 ± 10 | 3–12 | No/No | MN BMC | 1.8 | 50–70 | MRI | 4–15 | No | 6 |
| C) 40 ± 9 | Selected CD34+/ CXCR4+ cells | 0.02 | 100–120 | ||||||||||
| Traverse et al. (2010) | 40 | 3:1 | 54 | Tx) 49 ± 10 | 5 ± 2 | Yes/Yes | MN BMC | 1.0 | 50–70 | MRI | 3 ± 2 | No | 6 |
| C) 49 ± 9 | |||||||||||||
| Traverse et al. (2011) | 87 | 2:1 | 57 | Tx) 49 ± 12 | 17 (16–20) | Yes/Yes | MN BMC | 1.5 ± 0.2 | 80–90 | MRI | 17 | Yes | 6 |
| C) 45 ± 10 | |||||||||||||
| Traverse et al. (2012) | 120 | 2:1 | 57 | Tx) 45 ± 11 | 3 (3–4) | Yes/Yes | MN BMC | 1.5 ± 0.2 | 80–90 | MRI | 3 | Yes | 6 |
| C) 45 ± 11 | 8 (7–8) | ||||||||||||
| Turan et al. (2012) | 62 | 2:1 | 61 | Tx) 43 ± 10 | 7 | No/No | Nucleated BMC | 96 ± 32 | ∼120 | LV Angio (biplane) | 7 | No | 3 |
| C) 45 ± 10 | |||||||||||||
| Wollert et al. (2004) | 60 | 1:1 | 56 | Tx) 50 ± 10 | 6 ± 1 | No/No | Nucleated BMC | 25 ± 9 | 128 ± 33 | MRI | 4 ± 2 | No | 6 |
| C) 51 ± 9 |
BMC, bone marrow cells; EF-RNV, ejection fraction radionuclide ventriculography; LVEF, left ventricular ejection fraction; LV, left ventricle; LV angio, left ventricular angiography; MN BMC, mononuclear bone marrow cells; MRI, magnetic resonance imaging; N, number of patients; PCI, percutaneous coronary intervention; STEMI; ST-segment elevation myocardial infarction; TTE, transthoracic echocardiogram.
Tx, treatment arm; C, control arm.
In this analysis, 1494 patients had complete baseline and follow-up LVEF measurement, 1427 patients complete LVEDVI measurements (five patients were missing from one trial5 and LVEDVI was not available in another trial n = 6220) and 1349 patients complete LVESVI measurements (five patients missing from one trial5 and LVESVI data was not available in two trials, n = 62 and n = 7812,20).
The absolute incremental improvement in LVEF was greater among BMC-treated patients compared with controls: 2.55% increase (95% CI: 1.83 to 3.26, P < 0.001), Figure 2. There was heterogeneity across all three outcomes namely change in LVEF, LVEDVI, and LVESVI (respectively, I2 = 84%, I2 = 64%, and I2 = 70%) (see Supplementary material online, Appendix S4).
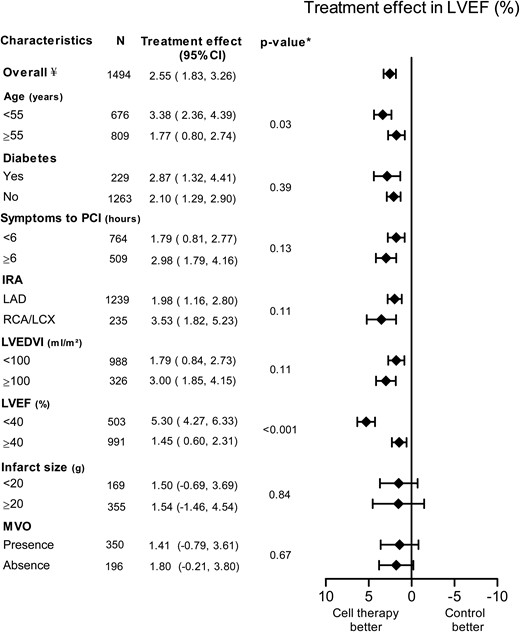
Pooled improvement of left ventricular ejection fraction (LVEF) of included cell therapy trials assessing different subgroups. CI, confidence interval; IRA, infarct-related artery; LAD, left anterior descending artery; LCX, left circumflex artery; LVEDVI, left ventricular end-diastolic volume index; LVEF, left ventricular ejection fraction; MVO, microvascular obstruction; PCI, percutaneous coronary intervention; RCA, right coronary artery. ¥ frequencies can vary across subgroups due to missing baseline characteristics values. *P-value for subgroup differences.
Patient characteristics
Treatment benefit in terms of LVEF improvement was more pronounced in patients with baseline LVEF < 40% (5.30%, 95% CI: 4.27 to 6.33) compared with LVEF ≥40% (1.45%, 95% CI: 0.60 to 2.31, P < 0.001). Also, patients <55 years of age had more benefit from BMC therapy (3.38%, 95% CI: 2.36 to 4.39) compared with patients age ≥55 years (1.77%, 95% CI: 0.80 to 2.74, P = 0.03). No significant interaction was observed between other subgroups and LVEF.
The overall effect of change of LVEDVI was −3.17 mL/m² in favour of BMC treatment (95% CI: −4.86 to −1.47, P ≤ 0.001, Figure 3). This decrease was more pronounced in patient with age <55 years (−5.70 mL/m², 95% CI: −9.18 to −2.21), compared with patients ≥55 years of age (−1.13 mL/m², 95% CI: −4.58 to 2.32, P = 0.001).
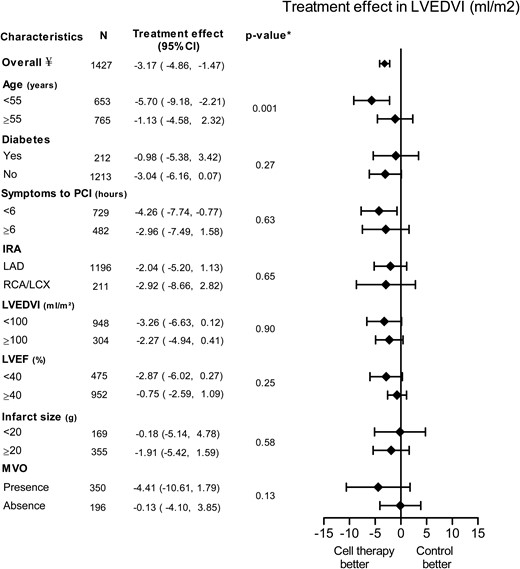
Pooled improvement of left ventricular end-diastolic volume index (LVEDVI) of included cell therapy trials assessing different subgroups. CI, confidence interval; IRA, infarct related artery; LAD, left anterior descending artery; LCX, left circumflex artery; LVEDVI, left ventricular end-diastolic volume index; LVEF, left ventricular ejection fraction; MVO, microvascular obstruction; PCI, percutaneous coronary intervention; RCA, right coronary artery. ¥ frequencies can vary across subgroups due to missing baseline characteristics values. *P-value for subgroup differences.
There was a significant decrease in change of LVESVI in the BMC group compared with the control group with a treatment effect of −2.60 mL/m2 (95% CI: −3.84 to −1.35, P < 0.001, Figure 4). Again, patients with age <55 years benefit most from BMC compared with age ≥55 years (−4.47 mL/m², 95% CI: −7.32 to −1.62 vs. −0.82 mL/m², 95% CI: −3.31 to 1.67, P = 0.002). Also, patients with baseline LVEF <40% had a more pronounced decrease in LVESVI (−4.74 mL/m², 95% CI: −10.23 to 0.74) compared with LVEF ≥40% (−0.91 mL/m², 95% CI: −2.48 to 0.66, P < 0.001). There was also an interaction between baseline LVEDVI and treatment effect. Patients with a smaller EDV at baseline had less treatment effect.
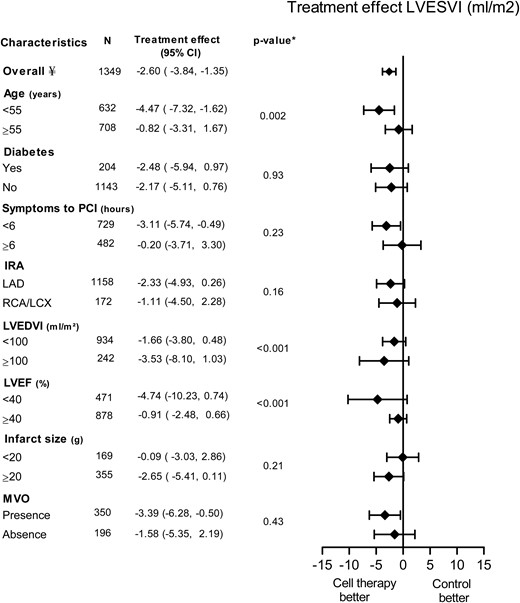
Pooled improvement of left ventricular end-systolic volume (LVESVI) of included cell therapy trials assessing different subgroups. CI, confidence interval; IRA, infarct-related artery; LAD, left anterior descending artery; LCX, left circumflex artery; LVEDVI, left ventricular end-diastolic volume index; LVESVI, left ventricular end-systolic volume index; LVEF, left ventricular ejection fraction; MVO, microvascular obstruction; PCI, percutaneous coronary intervention; RCA, right coronary artery. ¥ frequencies can vary across subgroups due to missing baseline characteristics values. *P-value for subgroup differences.
Trial characteristics
There was no difference in LVEF improvement between patients treated with cell infusion <7 days from primary PCI compared with ≥7 days (1.46%, 95% CI: 0.41 to 2.51 vs. 2.69%, 95% CI: 1.80 to 3.58, P = 0.08). Furthermore, we found no difference in LVEF improvement comparing patients with number of injected mononuclear BMC of <108 compared with ≥ 108 (2.80%, 95% CI: 0.79 to 4.80 vs. 0.58%, 95% CI: −0.44 to 1.59, P = 0.05), Table 2. Studies, using MRI as LV function assessment had a smaller treatment effect in LVEF when compared with non-MRI studies (0.16% 95% CI: −0.88 to 1.20 vs. 4.67%, 95% CI: 3.69 to 5.66, P < 0.001). There was no clear interaction between study design (blinded 1.36% 95% CI: −0.04 to 2.76 vs. open label 2.97%, 95% CI: 2.14 to 3.80, P = 0.05). These results were largely consistent in LVEDVI and LVESVI (Table 2).
Treatment effect of different trial characteristics included in this meta-analysis
| LV ejection fraction (%) | LV end-diastolic volume index (mL/m2) | LV end-systolic volume index (mL/m2) | |||||||
|---|---|---|---|---|---|---|---|---|---|
| n | Treatment effect (95% CI) | P-value* | n | Treatment effect (95% CI) | P-value* | n | Treatment effect (95% CI) | P-value* | |
| Time from PCI to cell infusion | |||||||||
| <7 days | 836 | 1.46 (0.41 to 2.51) | 0.08 | 802 | −3.53 (−5.89 to −1.18) | 0.62 | 802 | −2.88 (−4.70 to −1.06) | 0.41 |
| ≥7 days | 769 | 2.69 (1.80 to 3.58) | 640 | −4.36 (−6.66 to −2.05) | 640 | −3.94 (−5.69 to −2.19) | |||
| Total number of injected BMC | |||||||||
| <1 × 10⁸ | 314 | 2.80 (0.79 to 4.80) | 0.05 | 314 | −4.72 (−8.15 to −1.29) | 0.34 | 314 | −6.36 (−9.46 to −3.27) | 0.01 |
| ≥1 × 10⁸ | 1005 | 0.58 (−0.44 to 1.59) | 1005 | −2.78 (−4.85 to −0.70) | 927 | −1.97 (−3.58 to −0.36) | |||
| Imaging modality for LV function | |||||||||
| MRI | 981 | 0.16 (−0.88 to 1.20) | <0.001 | 976 | −1.50 (−3.82 to 0.82) | 0.02 | 976 | 0.16 (−1.54 to 1.85) | <0.001 |
| Other | 513 | 4.67 (3.69 to 5.66) | 451 | −5.63 (−8.11 to −3.15) | 373 | −5.85 (−7.69 to −4.01) | |||
| Study design | |||||||||
| Blinded | 558 | 1.36 (−0.04 to 2.76) | 0.05 | 558 | −1.93 (−4.96 to 1.09) | 0.24 | 480 | −2.41 (−4.60 to −0.21) | 0.84 |
| Open label | 936 | 2.97 (2.14 to 3.80) | 869 | −4.11 (−6.16 to −2.06) | 869 | −2.69 (−4.20 to −1.17) | |||
BMC, bone marrow cells; CI, confidence interval; LV, left ventricular; MRI, magnetic resonance imaging; n, number of patients; PCI, percutaneous coronary intervention.
*P-value for subgroup differences.
Discussion
In this collaborative meta-analysis, we found that autologous BMC infusion is associated with a moderate but statistically significant improvement of LV systolic function and remodelling in patients after STEMI. This is reflected by a larger increase in LVEF and a greater decrease in LVESVI and LVEDVI in the treated population. In additional subgroup analyses, younger patients and patients with more depressed LVEF at baseline had the largest benefit from BMC infusion.
Previous conventional meta-analyses have reported similar or somewhat larger benefit from BMC infusion then we observed. These meta-analyses reported, incremental LVEF changes of 2.7%24 and 3.02 to 4.0%25 in the most recent meta-analysis. However, the last and most recent meta-analysis included all patients with ischaemic heart disease, irrespective of study design (cohort study or randomized trials).25 Also, this meta-analysis conducted by Jeevanantham et al. did not include three large randomized controlled trials (BONAMI, HEBE, and REGENT trial) that were included in our analysis. Moreover, we have included only trials with at least 30 patients in the treatment arm. Most importantly, the present collaborative meta-analysis is the first one based on original data as provided by the principal investigators of the included trials. This increases accuracy and also allows subgroup analysis.
In our analysis, younger patients benefit more from cell therapy in terms of LV remodelling. Ageing is a significant predictor of impairment of endothelium-dependent vasodilation and there is an increased risk of atherosclerotic disease and poor outcomes in older patients. The accumulation of risk factors in the older population is linked to a decrease in both the absolute number as well as the function of stem cells.26
However, ageing itself seems to have a very strong influence on stem cell function and is accompanied by a decline in the homeostatic and regenerative capacity of all tissues and organs.27 Both experimental as well as clinical studies have shown lower absolute numbers as well as functionality of stem cells with increasing age.8,28 Bone marrow cells isolated from younger-aged rats showed increased efficacy in restoring LV function after myocardial infarction when compared with BMCs isolated from middle-aged rats.28
In patients with chronic ischaemic heart disease, a similar relation between age and stem cell function has been shown.29,30 In the conducted BMC therapy clinical trials, autologous BMCs are typically harvested from older patients who have recently suffered a myocardial infarction. In contrast, experimental studies in rodent models typically utilize donor BMCs isolated from young, healthy, inbred mice that are not the recipients. It has been postulated that this explains the much greater benefit of BMC therapy as observed in experimental studies.31
This might also have important implications for the therapeutic application of cell therapy. Future research should therefore focus on elucidating the crucial differences between young and aged BMCs and to reverse or alter these characteristics before delivery in a clinical setting.
In addition to younger age, we observed that patients with a more severely depressed LVEF at baseline had larger benefit from cell therapy. In fact, the effect in patients with an EF over 40% was practically non-existent, whereas in the group of patients with an EF <40% the increase was substantial showing an improvement of 5%. It is conceivable that such an improvement could alter the clinical outcome in this high-risk population. Again, this has implications for the design of future clinical trials. Especially at the present time, when most studies are designed as proof-of-principle studies instead of large clinical-outcome studies, the selection of patients is of utmost importance and should contain subjects with the largest potential benefit of the intervention.
Although reduced LVEF is associated with the presence of MVO and larger MRI infarct sizes, we did not find an association between the presence of MVO or infarct size and the effects of BMC infusion. However, these MRI parameters were only present in <37% of the patients included in this analysis and therefore results should be interpreted with caution.
Diabetes mellitus is one of the key risk factors for coronary artery disease, and its prevalence is expected to increase in the coming years. Diabetes mellitus leads to dysfunction of the endothelium and the microcirculation. Theoretically this could lead to a diminished response to BMC infusion, hampering adhesion and homing of these cells to the area of interest. Also the functionality and the absolute number of stem cells are reduced in diabetes mellitus.32,33 The reduction in cells was directly related to levels of HbA1c.33 Another study showed that the reduced number of CD34+KDR+ cells was associated with the severity of diabetic vasculopathy.34 Nevertheless, we did not observe a relationship between the presence of diabetes mellitus and efficacy of BMC infusion in our analysis. It should be noted though that our study population consisted of <16% of patients with diabetics.
Although the effect of BMC infusion on LVEF seems to be small it should be noted that other treatment modalities such as beta-blocker therapy or direct revascularization also have a relatively small influence on LVEF improvement.35 The question remains what the long-term effects of a single intracoronary BMC infusion are on LV function and remodelling and clinical outcomes. Additional meta-analyses are performed to address this question,24,36 but studies with long-term follow-up still remain limited. The large BAMI trial, funded by the European Union, will investigate BMC therapy in a randomized controlled trials with primary clinical endpoints in a STEMI population with 3000 patients and a LVEF <45% (NCT01569178). Lastly, several different strategies of cell isolation and infusion have been applied and it yet remains to be determined which is the most effective regimen.
Limitations
There are some limitations to our analysis that should be taken into account. As with any meta-analysis, limitations to the method include heterogeneity across trials. In particular, there are differences in terms of treatment characteristics including used cell dosage, cell isolation protocols, storage methods, and image modalities. Moreover, in our analysis, we have excluded trials with a cell therapy arm <30 participants [number of excluded patients is 322 (16%)]. We excluded the smaller trials for several reasons. First, we believe that subgroup assessment in these trials is less valuable due to small numbers. Secondly, we feel that publication bias is a larger problem in these small trials. Third, to our opinion, cell therapy involves a comprehensive protocol that involves a learning curve.
Conclusion
This is, to our knowledge, the first collaborative meta-analysis to assess the effects of intracoronary BMC therapy. Intracoronary BMC therapy leads to a modest but significant improvement of LV function in patients after STEMI. Patients of younger age and with a more severely depressed LVEF showed the largest benefit. This should be taken into account when designing future trials using intracoronary BMC infusion as an adjunctive therapy for STEMI. Most importantly, trials like the ongoing BAMI-trial that are powered to determine the effects of BMC infusion on clinical endpoints need to be awaited. Such trials will show whether the modest improvement of LV function translates in true clinical benefit.
Supplementary material
Supplementary material is available at European Heart Journal online.
Acknowledgements
We gratefully acknowledge the valuable contribution of Anouk Andriessen, Msc for her help with the manuscript preparation and Aeilko H. Zwinderman Msc, PhD for his statistical expert advice.
Conflict of interest: none declared.

