


Abstract
To assess the fate of incomplete stent apposition (ISA) after deployment of sirolimus-eluting stents (SESs).
Thirty-two patients having intravascular ultrasound (IVUS)-guided PCI with SESs underwent assessment of stent deployment with quantitative coronary angiography, IVUS, and optical coherence tomography (OCT) pre-procedure, post-procedure, and at 10 months follow-up. Incomplete stent apposition was defined as separation of a stent strut from the inner vessel wall by >160 µm. At follow-up, 4.67% of struts with ISA at deployment failed to heal and 7.59% which were well apposed did not develop neointimal hyperplasia even after 10 months. Lesion remodelling was responsible for the development of late ISA in only 0.37% of struts. Failure of adequate neointimal hyperplasia was quantitatively the most important mechanism responsible for persistent acute ISA, classified in previous studies, which relied only on follow-up OCT, as late ISA. Thrombus was visualized in 20.6% of struts with ISA at follow-up and in 2.0% of struts with a good apposition (P < 0.001).
In patients with SESs, ISA can fail to heal and even complete apposition can be associated with no neointimal hyperplasia. Incomplete stent apposition without neointimal hyperplasia was significantly associated with the presence of OCT-detected thrombus at follow-up, and may constitute a potent substrate for late stent thrombosis.
Introduction
Incomplete stent apposition (ISA) has been implicated as a potential factor in the subsequent development of late stent thrombosis (LST) in patients treated with drug-eluting stents (DESs).1,2 The inception of DESs promised to herald a new era in interventional cardiology in which the nemesis of restenosis would finally be largely overcome.3,4 However, early promising results with DESs and enthusiasm for their use have been tempered by the relatively rare but devastating development of LST.5 The precise mechanisms responsible for the latter complication remain incompletely understood; however, a number of factors have emerged as being potentially important. Underexpansion or underdeployment of stents was identified early on as a risk factor. In recent times, however, ISA, that is, lack of contact between stent struts and the underlying intima, and as a result, incomplete strut coverage by neointima, has been implicated as another potential predisposing factor.1,2 Cook et al.1 in their intravascular ultrasound (IVUS)-based case–control study found that ISA was highly prevalent in patients with very LST after DES implantation. However, as a technique, IVUS may underestimate ISA because of its limited axial resolution and problems with stent-related artefacts.2,6,7 This very same limitation may underestimate the development of neointimal hyperplasia, which can both give rise to restenosis and can also provide a protective non-thrombogenic coating to stent struts.6,8,9 Studies with optical coherence tomography (OCT), a technique with high axial resolution able to resolve detail down to 10 µm, have revealed that IVUS identifies numerous stent struts with ISA as bare when in fact they have been coated by neointimal hyperplasia.6,8–12
Incomplete stent apposition can be acute—occurring at the time of stent deployment, or late, persisting from stent deployment or acquired at subsequent follow-up.2 To date, there have been no studies of ISA using both OCT and IVUS examinations at the time of deployment and subsequent follow-up. The few studies that have been performed have been limited by a combination of small numbers, incomplete follow-up, and the use of OCT only at follow-up.6,8,10,13 As a result, the precise mechanisms responsible for apparently late ISA remain unclear. Crucially, the fate of ISA immediately post-procedure is unknown.
To elucidate the fate of post-procedure ISA and thereby potentially LST, we undertook the first study assessing ISA using both IVUS and OCT immediately after deployment of sirolimus-eluting stents (SESs) and at subsequent follow-up.
Methods
Patient selection, inclusion and exclusion criteria
Between September 2005 and May 2007, 32 consecutive patients undergoing PCI with single SES implantation were recruited to the study. All patients had baseline OCT, IVUS, and quantitative coronary angiography (QCA) performed, which was then used to guide subsequent coronary intervention. This was followed by assessment of the stents with IVUS and OCT immediately post-procedure and again at 10 months follow-up. Only native coronary artery lesions were included in the study. Patients were excluded if they had lesions located in totally occluded or tortuous vessels because of the difficulty in performing precise intracoronary imaging. Those with ostial or left main stem lesions were also excluded as such lesions preclude the performance of OCT. Only patients requiring a single stent to treat a given lesion were studied to avoid the potentially confounding effects of overlapping stent struts and long stented segments on thrombosis risk. The study was approved by the local ethics committee of Fujita Health University and was carried out according to the guidelines of the Declaration of Helsinki. Written informed consent was obtained from all patients.
Image acquisition
A 7Fr guiding catheter was introduced through the femoral approach after the administration of intravenous heparin at 100 IU/kg. Selective coronary angiography was performed after the intracoronary injection of nitrates. Following the passage of a 0.014 in. guidewire across the lesion, a mechanical IVUS catheter (40 MHz, 2.5Fr, Boston Scientific, Natick, MA, USA) was introduced over the wire and positioned distal to the lesion.14,15 The lesion was then imaged using motorized pullback (0.5 mm/s). Intravascular ultrasound images were stored electronically for offline analysis. All the lesions were then treated with stent implantation using standard techniques at the operator's discretion. Intravascular ultrasound was used to ensure adequate stent expansion. Intravascular ultrasound examination was then repeated after successful stent deployment. The IVUS criteria for optimal stenting in this study were commonly used criteria originally derived from the MUSIC study:1 good stent apposition with symmetric stent expansion;2 full stent expansion with sufficient lumen area (i.e. lumen area 90% or greater of the average reference lumen area pre-intervention);3 and the absence of major dissection.16 To fulfil these criteria, high-pressure intra-stent balloon inflation was performed.17
Subsequently, an over-the-wire occlusion balloon catheter was positioned proximal to the stent and the 0.014 in. guidewire was then removed and exchanged for a 0.016 in. OCT image wire (LightLab Imaging, Westford, MA, USA). Following the careful passage of the 0.016 in. OCT image wire through the stented segment, the proximal occlusion balloon catheter was inflated and lactated Ringer's solution was continuously flushed through the lumen to remove blood flow. Motorized pullback was started at a rate of 1.0 mm/s for a length of 30 mm. The images were saved in the OCT image system digitally for subsequent analysis.12,13,18–21
All patients underwent clinical and angiographic follow-up at 10 months together with IVUS and OCT assessment of the stents.
Intracoronary imaging image analysis
Intracoronary image analysis was performed by the consensus of three experienced blinded observers (Y.O., M.O., K.H.) with no access to clinical records during assessment.
Quantitative coronary angiography analysis was performed using the computer-based edge-detection Coronary Angiography Analysis System (CAAS II, Pie Medical, Maastricht, The Netherlands).14,17,22 Interpolated reference vessel diameter, minimal lumen diameter (MLD), and percentage diameter stenosis were obtained using the guiding catheter as a scaling device from the QCA system.14,17,22
Intravascular ultrasound-verified cross-sectional luminal area was defined as the integrated area central to the intimal leading edge echo.14,15 The total vessel cross-sectional area was defined as the area inside the interface between the plaque–media complex and the adventitia (area inside the external elastic membrane).14,15 This was assessed in the reference segments and at the MLD pre-intervention. The stented area was evaluated post-procedure and at follow-up in the proximal, middle, and distal stented segments.
Cross-sectional OCT images were analysed at every 1 mm.11,13 The presence and thickness of neointimal coverage were measured. Incomplete stent apposition was defined as separation of a stent strut from the inner vessel wall by a distance between the surface of the stent strut and vessel wall greater than or equal to the axial resolution of the OCT instrument used (20 µm) plus the width of the stent strut including the polymer coating (140 µm) in segments without a side branch. For SES, this amounted to a separation of >160 µm.23 Stent struts were classified as well apposed or incompletely apposed. The fate of these two groups was then further classified into: Thrombi were identified as masses protruding into the vessel lumen. While red thrombi consisting mainly of red blood cells were observed as high-backscattering protrusions with signal-free shadowing by OCT, white thrombus containing mainly platelets and white blood cells was characterized by signal-rich and low-backscattering billowing projections protruding into the lumen.24 Fibrin clot was identified as a signal-rich clot without backscattering.25
Well apposed initially:
with subsequent neointimal hyperplasia at follow-up;
without subsequent neointimal hyperplasia at follow-up; and
with subsequent incomplete apposition owing to lesion/vascular remodelling at follow-up, i.e. positive vessel remodelling or dissolution of jailed thrombus, respectively.1 Lesions were classified as having undergone positive remodelling if there was an increase in vessel surface area from baseline with evidence of well-apposed stent struts at baseline, but ISA with increased vessel internal surface area and fixed stent area at follow-up. An alternative means of arriving at the same situation may be dissolution of jailed thrombus (lesion remodelling) by the time of follow-up.
Incompletely apposed initially then:
fully healed with neointimal hyperplasia at follow-up; and
preserved incomplete apposition without neointimal hyperplasia at follow-up.
Statistical analysis
Data were analysed using the SAS statistical software package (SAS Institute, Cary, NC, USA). All continuous values are expressed as mean ± SD for normally distributed variables or median ± interquartile range for non-parametric data. The Kolmogorov–Smirnov test was used to assess the normality of continuous data. Differences between parametric continuous variables were assessed using unpaired or paired t-tests as appropriate. Differences between non-parametric continuous variables were evaluated using the Mann–Whitney U-test, and for paired variables, the Wilcoxon test. Qualitative data are presented as frequencies. Differences in categorical variables were assessed using the χ2 and Fisher's exact tests.
Intra- and inter-observer variability in neointimal thickness measurements was assessed using the method of Bland and Altman26 as well as by calculating concordance correlation coefficients. Two-tailed values of P < 0.05 were considered significant.
Results
A total of 32 patients with SESs were studied with 100% clinical and angiographic follow-up at a mean duration of 10.2 ± 3.1 months (Table 1). Baseline clinical and angiographic characteristics at the time of intervention are summarized in Table 1. Of the 32 patients, 14 had acute coronary syndromes: nine presented with NSTEMI and five with unstable angina. The remaining 18 patients had stable angina.
Baseline clinical, angiographic, and lesion characteristics
| SES | |
|---|---|
| Patient/number of stent (n) | 32/32 |
| Age (y) | 65.2 ± 8.2 |
| Male (n, %) | 30 (93.8) |
| Hypertension (n, %) | 18 (56.3) |
| Hypercholesterolemia (n, %) | 18 (56.3) |
| Diabetes Mellitus (n, %) | 12 (37.5) |
| Smoking (n, %) | 9 (28.1) |
| NSTEMI (n, %) | 9 (28.1) |
| Stent length (mean ± SD, mm) | 19.3 ± 3.6 |
| Stent diameter (mean ± SD, mm) | 2.9 ± 0.3 |
| Lesion location in the vessel (LAD, LCX, RCA, n, %) | 17 (53), 4 (13), 11 (34) |
| Lesion characteristics (A/B1/B2/C, n, %) | 8 (25)/13 (40)/7 (22)/4 (13) |
| Ejection fraction (%) | 56.1 ± 7.3 |
| Follow-up duration (month) | 10.2 ± 3.1 |
| Restenosis rate (n, %) | 1 (3.1) |
NSTEMI, Non-ST elevation myocardial infarction; LAD, left anterior descending coronary artery; LCX, left circumflex coronary artery; RCA, right coronary artery.
The results of QCA and IVUS analysis, pre-intervention, post-intervention, and at follow-up are summarized in Table 2. We found that OCT detected a higher incidence of ISA relative to IVUS in the slice analysis (11.0 vs. 5.7%, P < 0.001), reflecting the higher resolution of OCT. This proved more relevant than missing neointimal hyperplasia by IVUS and misclassifying a well-apposed stent strut as malapposed.
Serial quantitative coronary angiography, intravascular ultrasound, and optical coherence tomography pre-intervention, post-intervention and at follow-up
| Pre-intervention | Post-intervention | Follow-up | |
|---|---|---|---|
| QCA (mm) | |||
| RD | 2.64 ± 0.51 | 3.06 ± 0.47 | 2.76 ± 0.36 |
| MLD | 1.06 ± 0.25 | 2.57 ± 0.56 | 2.30 ± 0.52 |
| %DS | 59.6 ± 8.5 | 16.1 ± 10.1 | 16.5 ± 15.0 |
| IVUS (mm2) | |||
| Prox. ref. VA | 13.13 ± 2.50 | 13.71 ± 2.90 | 13.24 ± 3.21 |
| Lesion VA | 11.68 ± 2.82 | 13.36 ± 2.97 | 13.38 ± 3.46 |
| Distal ref. VA | 12.37 ± 2.74 | 12.79 ± 3.05 | 12.72 ± 2.91 |
| Prox. ref. LA | 7.45 ± 1.58 (IVUS-1) | 7.75 ± 1.76 (IVUS-2) | 7.64 ± 1.79 (IVUS-3) |
| Lesion LA | 2.14 ± 0.43 (IVUS-4) | 7.63 ± 1.94 (IVUS-5) | 7.54 ± 2.30 (IVUS-6) |
| Distal ref. LA | 7.37 ± 2.06 (IVUS-7) | 7.62 ± 2.26 (IVUS-8) | 7.48 ± 2.14 (IVUS-9) |
| OCT (mm2) | |||
| Prox. ref. LA | 7.18 ± 1.49 (OCT-1) | 7.43 ± 1.40 (OCT-2) | 7.24 ± 1.41 (OCT-3) |
| Lesion LA | 1.38 ± 0.47 (OCT-4) | 7.46 ± 1.65 (OCT-5) | 7.06 ± 1.94 (OCT-6) |
| Distal ref. LA | 7.02 ± 1.97 (OCT-7) | 7.32 ± 1.60 (OCT-8) | 7.14 ± 1.62 (OCT-9) |
RD, reference vessel diameter; MLD, minimal lumen diameter; VA, vessel area; LA, lumen area. No difference was found between IVUS and OCT measurements in proximal LA follow-up, lesion LA post-intervention, distal LA post-intervention, and distal LA follow-up (P = ns in IVUS-3 vs. OCT-3, IVUS-5 vs. OCT-5, IVUS-8 vs. OCT-8, and IVUS-9 vs. OCT-9 respectively), whereas significant difference was observed between IVUS and OCT in proximal LA pre-intervention, proximal LA post-intervention, lesion LA pre-intervention, lesion LA follow-up, and distal LA pre-intervention (P < 0.05 in IVUS-1 vs. OCT-1, IVUS-2 vs. OCT-2, IVUS-4 vs. OCT-4, IVUS-6 vs. OCT-6 and IVUS-7 vs. OCT-7, respectively).
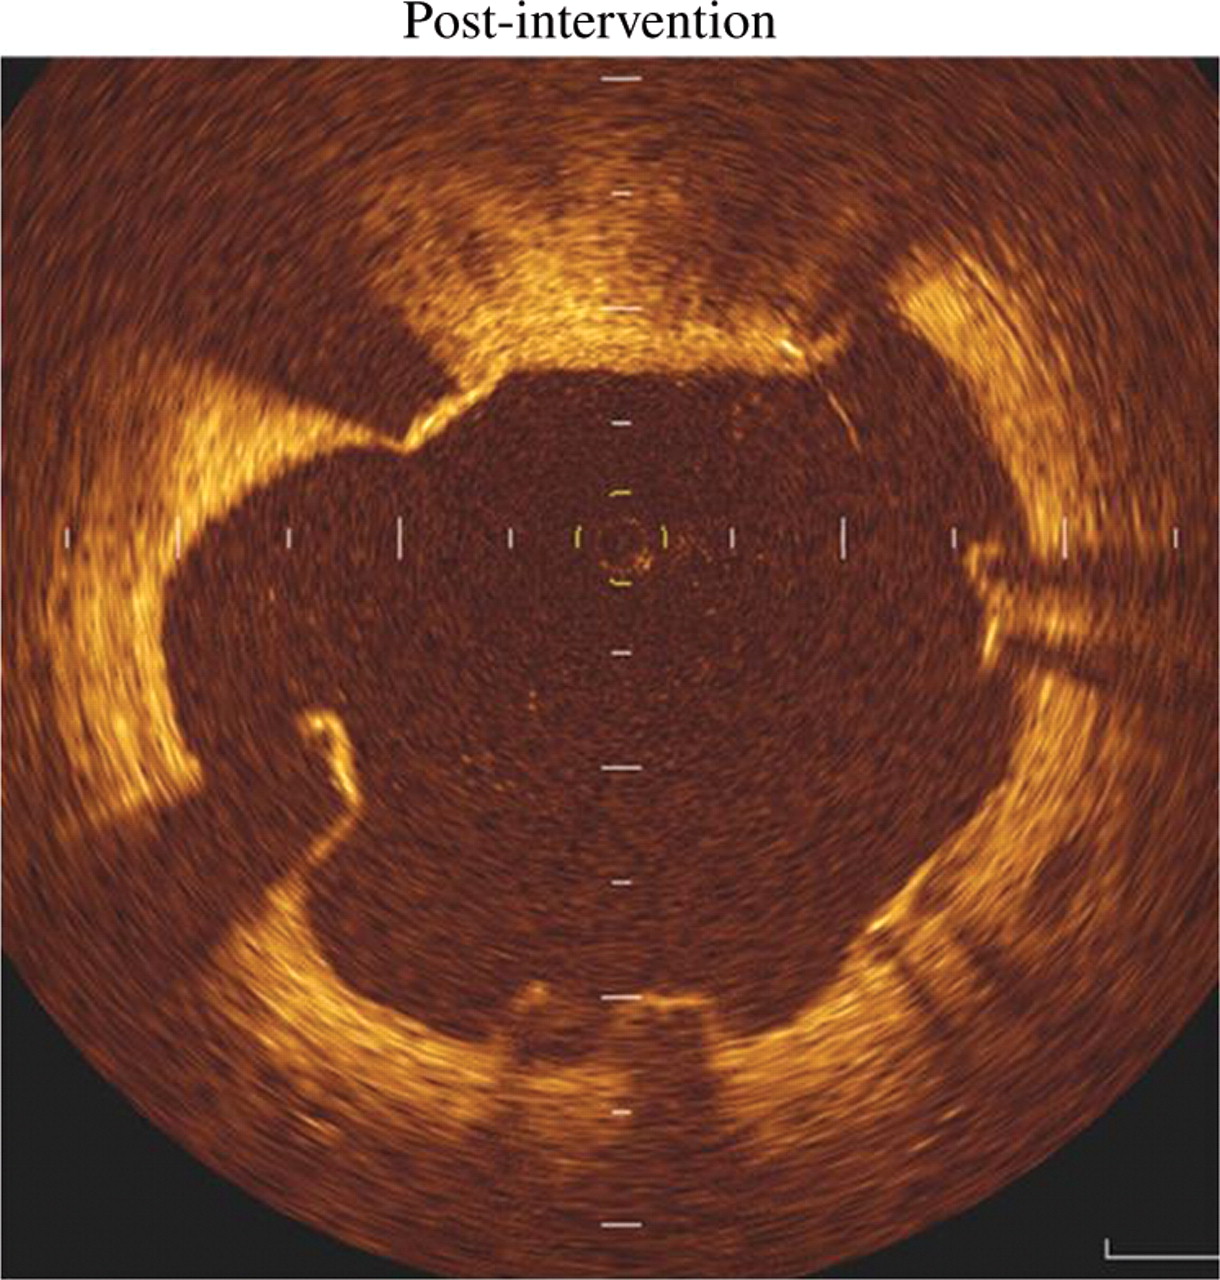
Of the stent struts analysed, 7.15% were malapposed immediately after intervention. Representative examples are illustrated in Figure 1. The subsequent fate of these struts is summarized in Table 3.
Summary of state of stent struts post-intervention and fate at follow-up
| Post-intervention | Follow-up |
|---|---|
| Well apposed, n = 4011 (92.85%) | With neointimal covering, |
| n = 3667 (84.89%) | |
| Without neointimal covering, | |
| n = 328 (7.59%) | |
| ISA owing to vessel/lesion remodelling, | |
| n = 16 (0.37%) | |
| Incompletely apposed, n = 309 (7.15%) | Healed ISA with neointimal hyperplasia, |
| n = 107 (2.48%) | |
| Preserved ISA without neointimal hyperplasia, n = 202 (4.67%) |
ISA, incomplete stent apposition.
Representative optical coherence tomography-derived cross-sectional image demonstrating incomplete stent strut apposition post-intervention.
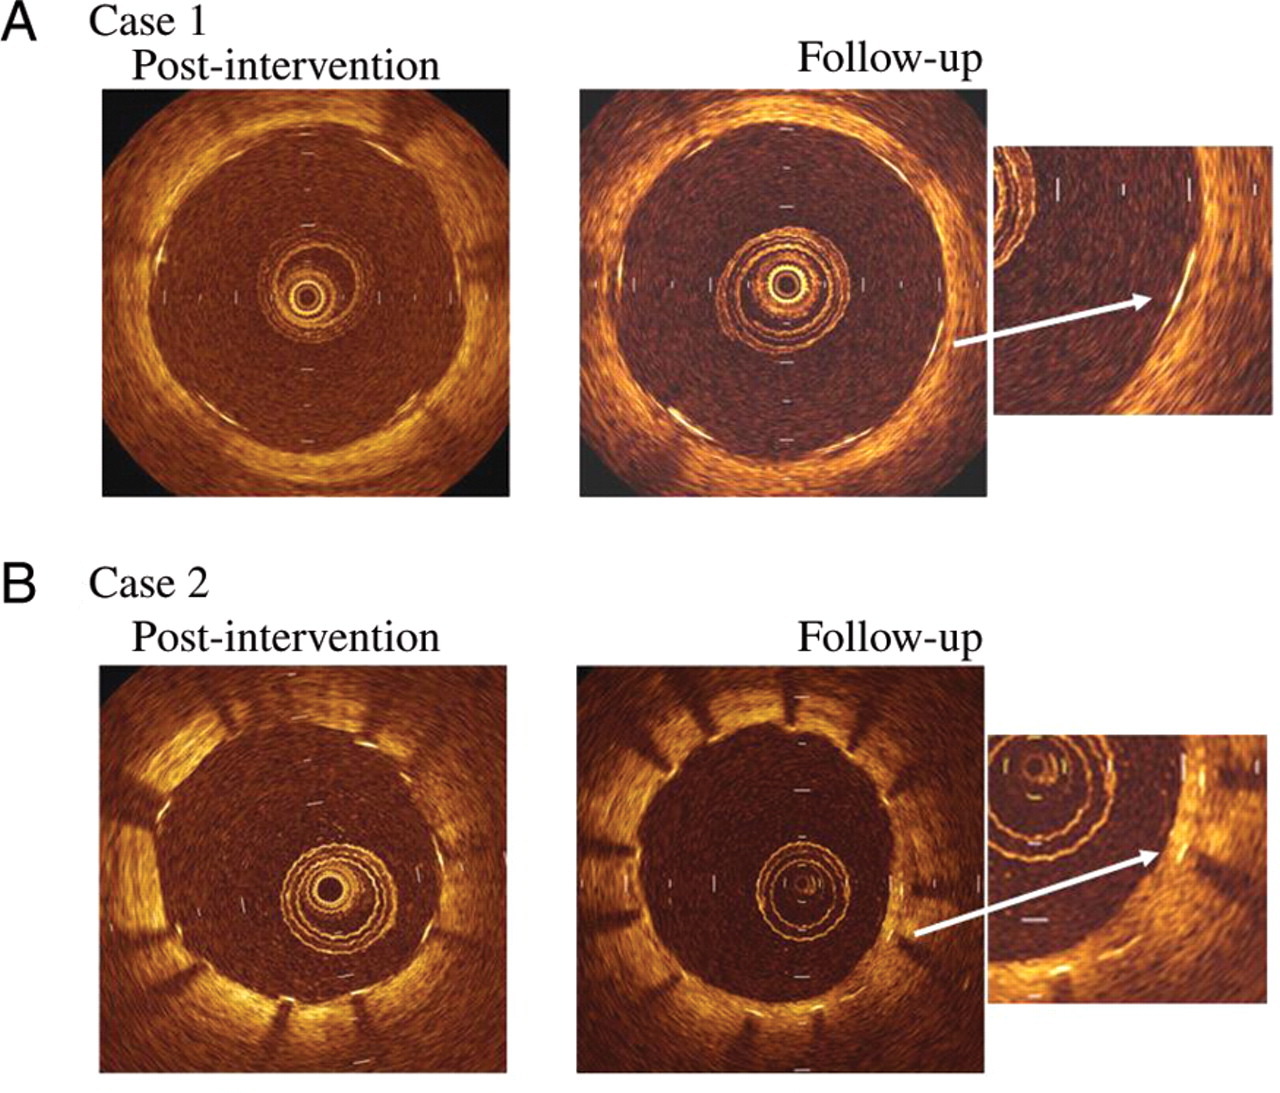
Only a small proportion of stent struts that were well apposed immediately after intervention developed subsequent malapposition at follow-up owing to vascular remodelling and/or dissolution of jailed thrombus, suggesting that this is a quantitatively less important mechanism of late ISA than preservation of acute ISA. A substantial number of struts remained without a neointimal covering at 10 months follow-up despite being well apposed. The frequency distribution of neointimal thickness on stent struts is summarized in Figure 2 and representative examples of well-apposed struts with and without neointimal covering are presented in Figure 3. Incomplete stent apposition at 10 months follow-up was derived more frequently from preserved ISA (i.e. acute ISA) without neointimal hyperplasia rather than acquired ISA owing to vessel/lesion remodelling (Table 3).
Frequency distribution of neointimal thickness on sirolimus-eluting stent struts at follow-up as measured by optical coherence tomography. The median thickness was 50 µm with 25th and 75th percentiles at 30 µm and 90 µm, respectively. At follow-up, 12.63% of struts appeared to be uncovered.

Representative examples of optical coherence tomography-derived cross-sectional images post-intervention and at follow-up demonstrating a well-apposed stent strut with (A) no evidence of intimal covering (case 1); and (B) evidence of intimal hyperplasia (case 2).
There was no significant difference in age, follow-up duration, stent length, and stent area between the ISA and well-apposed groups; however, the incidence of NSTEMI as the initial clinical presentation was significantly higher in patients with ISA than those without (five out of seven patients vs. four out of 25 patients, P = 0.020).
A total of 4320 struts were observed in a total of 616 slices by every 1 mm (7.01 stent struts per slice). We also performed slice-based analysis. A total of 616 slices were analysed to assess both the extent of the neointimal hyperplasia and to check for the presence of thrombus. These data are summarized in Table 4. For neointimal thickness measurements, the intra-observer variability was 2.6 ± 9.7 µm with a concordance correlation coefficient of 0.993 and the inter-observer variability was 1.8 ± 9.7 µm with a correlation coefficient of 0.984.
Summary of slice analysis measured by optical coherence tomography at follow-up
| Well apposed (n = 548) | ISA (n = 68) | P-value | |
|---|---|---|---|
| Number of detected struts | 7.0 ± 0.8 | 7.1 ± 0.6 | 0.475 |
| Presence and absence of thrombus | |||
| Thrombus (n, %) | 11 (2.0) | 14 (20.6) | <0.001 |
| No thrombus (n, %) | 537 (98.0) | 54 (79.4) | — |
| ISA dimensions | |||
| ISA area (mm2) | 0 | 0.12 ± 0.06 | — |
ISA, incomplete stent apposition.
New thrombus was detected in 25 (4.1%) of 616 slices in the SES group. A representative example is presented in Figure 4. Thrombus was seen with significantly greater frequency in slices associated with ISA than those with well-apposed struts (20.6 vs. 2.0%, P < 0.001) (Table 4). Of the small number of well-apposed struts which developed thrombosis in the SES group, only two of 11 slices involved struts that had no neointimal coverage. However, none of the cases were associated with any clinically apparent stent thrombosis over the duration of follow-up.
Representative optical coherence tomography-derived cross-sectional image demonstrating thrombus associated with an incompletely apposed stent strut (left panel) as well as thrombus associated without incompletely apposed stent strut (right panel). White long arrow indicates thrombus (left and right panels) and triangles demonstrate stent struts (right panel).
Discussion
Our work represents the first study to evaluate the role and mechanisms by which late ISA develops using IVUS and OCT both immediately after intervention and at follow-up. Previous studies have relied only on OCT at follow-up and have therefore been unable to comment on either the fate of acute ISA, or, ipso facto, the origin of late ISA where OCT was only carried out at follow-up.6,8,10 Our findings suggest that the primary mechanism responsible for persistent acute ISA, identified at follow-up in previous studies as late ISA, is likely to be inhibition of neointimal hyperplasia.
Bare metal stents prevent acute recoil after PCI and place physical limits on the extent of negative remodelling, but have no substantive impact on neointimal hyperplasia.3 Indeed, the presence of the stent struts may incite this process, which if overexuberant may result in restenosis. Nevertheless, some degree of neointima formation over time is necessary to cover the otherwise thrombogenic surface of naked stent struts.5,27,28 Drug-eluting stents are designed to prevent or attenuate neointimal hyperplasia.3 It is therefore unsurprising that a substantial number of stent struts, even those that were well apposed, remained uncovered even after 10 months follow-up.
Gonzalo et al.13 have recently reported that ISA and uncovered struts were more frequently found in patients with STEMI than those with angina. They concluded that DES implantation in patients with STEMI was an independent predictor for ISA and uncovered stent struts.13 Nakazawa et al.29 recently reported using pathological data that vessel healing at the culprit site of AMI treated with DESs was substantially delayed in comparison with the culprit site of stable angina patients receiving DESs. We also found that SES implantation in the context of NSTEMI was significantly associated with ISA. Our finding that ISA is more likely to occur in an acute lesion with infarction appears to be in agreement with their clinical and pathological findings.13,29
Interestingly, OCT-detected thrombosis was seen in a significantly greater proportion of stent struts that were malapposed at follow-up. Of the struts that were well apposed but nevertheless associated with thrombosis, only two of 11 slices had no detectable evidence of neointimal hyperplasia. In those that did appear to have coverage, we speculate that there may have been some inadequacies either in the depth or quality of coverage or that what was thought to be neointimal hyperplasia may in fact have been fibrin.25 We speculate that the greater prevalence of attached thrombosis in incompletely apposed struts relative to well-apposed but nevertheless uncovered struts reflects the combination of a greater exposed surface area of the stent strut relative to well-apposed stents, and possible local flow disturbances. Although the OCT-detected thrombus appears to have been clinically silent over the relatively short duration of follow-up in our study (mean follow-up of 10 months), this finding together with the presence of uncovered struts underscores the need for prolonged dual antiplatelet therapy with aspirin and clopidogrel for at least 12 months.
Intravascular ultrasound-based substudies of DES trials have identified a high incidence of ISA, but this was not paralleled by the subsequent incidence of LST.2 However, this may in part be related to the duration of follow-up being potentially inadequate. Some OCT-based studies have shown that a substantial number of stent struts classified as bare with IVUS are in fact covered with a potentially protective layer of neointima.6,8–10 In our study, however, OCT detected a greater number of struts with ISA than IVUS. The superiority of OCT as a modality in this setting could lie in its ability to resolve small gaps between the stent struts and the vessel wall which are often missed by IVUS. This fact, together with a lack of statistical power, may lead to erroneous conclusions when using IVUS data alone to assess ISA and strut neointimal coverage.
Nevertheless, the rates of ISA remain vastly greater than the incidence of LST. This suggests that while ISA may play a role in LST, it is not necessarily a sine qua non for stent thrombosis and is but one factor in a complex interplay between host biological factors, stent properties, and the extent of deployment.5,30 This is also in keeping with Virchow's paradigm for intravascular thrombosis which postulates a tripartite role for vascular abnormalities, local flow disturbances, and a prothrombotic diathesis. The very properties of DESs that allow them to tame neointimal hyperplasia and thereby ameliorate restenosis, by resulting in incomplete stent strut neointimal coverage and by inference, endothelialization, may yet come to represent the Achilles heel of DESs. Our study demonstrates the importance of using OCT both after intervention and at follow-up when attempting to address the mechanisms and clinical significance of ISA. While Cook et al.1 reported that ISA was significantly associated with LST, although a potent risk factor and predictor of this, as one among many technical and predisposing host factors, ISA does not always in isolation produce clinically apparent thrombosis. It is likely that this process occurs more frequently in a silent manner and that only a small proportion of cases fully progress to clinically apparent events, analogous to the situation with plaque rupture which does not always uniformly evolve into ST-elevation MI. Further long-term clinical studies using both IVUS and OCT are required to more clearly delineate the role of ISA and incomplete neointimal coverage in the development of LST.
Limitations
Our study has a number of limitations. The number of patients investigated is relatively small, but reflects the difficulties in performing multimodality intravascular imaging. Nevertheless, we managed to achieve a 100% follow-up rate, and the study was similar in size to comparable previous studies.6,10 Our reliance on OCT by necessity excluded patients with ostial and left main stem disease, where the need for proximal balloon occlusion to achieve the blood-free medium required for OCT is not possible. This limitation may be overcome in the future using optical frequency domain imaging.12,21 However, it is unlikely that stents in these locations will behave in a materially different way from those that were examined in the present study.
Although OCT is a high-resolution modality, it may not be able to differentiate small amounts of fibrin clot from minimal neointima formation after DES implantation.25 As a result, it is possible that we may have underestimated both the extent of ISA and thrombus formation. We carefully restricted our definition of thrombus to a protruding mass with a clear border to avoid this ambiguity and minimize the effect of this limitation of OCT on our results. Additionally, the presence of red thrombus may render some stent struts invisible because of its high signal attenuation. However, only three of the slices analysed were affected in this way and, therefore, this limitation of OCT is unlikely to have significantly altered our results and conclusions.
The identification of thrombus in association with some stent struts at follow-up was not associated with clinically significant adverse events, and we are unable to definitively comment on the long-term significance of this finding. However, a study to address the association of ISA and LST prospectively would require very large numbers given the relative rarity of LST, and very long-term clinical and imaging follow-up, which is not practical at present. This remains the first study to examine the fate of ISA, as ascertained immediately post-PCI, and then at follow-up, and also the potential relationship between this and thrombosis.
Conclusions
Failure of ISA to heal with time occurs in a substantial number of stent struts in patients with SESs. The presence of late ISA was significantly associated with the development of OCT-detected thrombus at follow-up, which was also seen to a lesser extent with complete stent apposition. The presence of late ISA and the absence of neointimal hyperplasia could constitute a potent thrombogenic substrate for LST and warrants further study.
Funding
This study was supported by an unrestricted grant from Fujita Health University, Toyoake, Japan, and from Suzuken Memorial Foundation, Nagoya, Japan.
Conflict of interest: none declared.
Acknowledgements
We are grateful to all the staff of the catheterization laboratory, coronary care unit, and cardiac wards at Fujita Health University Hospital for their dedication and contribution. The authors wish to thank Prof. Hitoshi Hishida for his helpful advice.
References
Author notes
The first two authors contributed equally to the study.


Comments
Periklis A. Davlouros, MD, PhD, Ioanna Xanthopoulou, MD, Dimitrios Alexopoulos, MD, PhD, FESC, FACC
Cardiology Department, Patras University Hospital, Greece
Dear Editor
We read with great interest the manuscript by Ozaki et al in the June 31 issue of the European Heart Journal, the first study evaluating the role and mechanisms by which late incomplete stent apposition (ISA) develops using intravascular ultrasound and optical coherence tomography (OCT) both immediately following drug-eluting stents (DES) implantation and at follow-up.(1)
There is no doubt that OCT constitutes an excellent research tool for evaluation of both surrogates of DES efficacy (degree of neointimal hyperplasia) and safety (incidence of uncovered struts, ISA and micro- thrombus). However the real clinical significance of such surrogates remains obscure and large serial and long term studies will be required to finally conclude on this issue.(2, 3)
Nevertheless, accumulating data from randomised or observational studies with OCT are being used to evaluate various stent development technologies like durable vs. biodegradable polymer carriers or polymer free DES, regarding differences in the above mentioned surrogates.(3, 4) Therefore we should also be able to compare results between studies, however this requires a uniform method for data handling and presentation. In this regard, there is one issue which in our view needs further clarification and was raised by the recent Leaders OCT substudy concerning statistical methods in data with significant hierarchical clustering.(3) More specifically, Barlis et al. in the above mentioned study stated that standard statistical approaches are not appropriate for data with significant clustering (i.e. struts-stents-lesions-vessels-patients). Actually the authors characterised results derived by simple chi-square and Fisher exact test, which were also used by Ozaki et al., as naive statistics, and instead used a hierarchical Bayesian model for both power calculations and statistical analysis. The latter resulted in a more conservative weighted estimate of the proportion of exposed and malapposed struts per stent compared to the so called naive statistics. However many previous OCT studies have reported standard statistical results and certainly the statistical methods used in the LEADERS OCT substudy are both difficult to be conducted with standard statistical packages and to be understood. Our group was recently asked during the reviewing process to revise a similar observational OCT manuscript using higher level statistics similarly to the LEADERS study.(5) We were unable to perform a Bayesian analysis, therefore we performed a hierarchical multilevel analysis, reporting least squares estimates (LSE) and 95% confidence intervals (CI) of the primary and secondary end points derived by applying a hierarchical ANCOVA (mixed-effects) model to control for the random and fixed effects of the strut, stent and patient characteristics. However, in the final version of our manuscript we presented both the latter, as well as the results derived from standard statistics for comparison reasons with studies similar to ours. Other investigators have also reported results derived from mixed effects models regarding the proportions of uncovered and malapposed struts.(6) Diversity in the reported results derived from different statistical methods may create confusion. Therefore we think that it would be useful to have a uniform approach regarding statistical handling of data derived from such OCT studies, which would facilitate comparisons among them.
References
1. Ozaki Y, Okumura M, Ismail TF, Naruse H, Hattori K, Kan S, Ishikawa M, Kawai T, Takagi Y, Ishii J, Prati F, Serruys PW. The fate of incomplete stent apposition with drug-eluting stents: an optical coherence tomography-based natural history study. European heart journal 2010; 31(12):1470-1476.
2. Mintz GS. What to do about late incomplete stent apposition? Circulation 2007; 115(18):2379-2381.
3. Barlis P, Regar E, Serruys PW, Dimopoulos K, van der Giessen WJ, van Geuns RJ, Ferrante G, Wandel S, Windecker S, van Es GA, Eerdmans P, Juni P, di Mario C. An optical coherence tomography study of a biodegradable vs. durable polymer-coated limus-eluting stent: a LEADERS trial sub-study. European heart journal; 31(2):165-176.
4. Moore P, Barlis P, Spiro J, Ghimire G, Roughton M, Di Mario C, Wallis W, Ilsley C, Mitchell A, Mason M, Kharbanda R, Vincent P, Sherwin S, Dalby M. A randomized optical coherence tomography study of coronary stent strut coverage and luminal protrusion with rapamycin-eluting stents. Jacc 2009; 2(5):437-444.
5. Davlouros P, Nikokiris G, Karantalis V, Mavronasiou E, Xanthopoulou I, Damelou A, Tsigkas G, Alexopoulos D. Neointimal coverage and stent strut apposition six months after implantation of a paclitaxel eluting stent in acute coronary syndromes: An optical coherence tomography study International journal of cardiology 2010; Epub ahead of print.
6. Kim JS, Jang IK, Kim JS, Kim TH, Takano M, Kume T, Hur NW, Ko YG, Choi D, Hong MK, Jang Y. Optical coherence tomography evaluation of zotarolimus-eluting stents at 9-month follow-up: comparison with sirolimus -eluting stents. Heart (British Cardiac Society) 2009; 95(23):1907-1912.
Conflict of Interest:
None declared