


Abstract
Takotsubo cardiomyopathy (TTC) remains a potentially life-threatening disease, which is clinically indistinguishable from acute myocardial infarction (MI). Today, no established biomarkers are available for the early diagnosis of TTC and differentiation from MI. MicroRNAs (miRNAs/miRs) emerge as promising sensitive and specific biomarkers for cardiovascular disease. Thus, we sought to identify circulating miRNAs suitable for diagnosis of acute TTC and for distinguishing TTC from acute MI.
After miRNA profiling, eight miRNAs were selected for verification by real-time quantitative reverse transcription polymerase chain reaction in patients with TTC (n = 36), ST-segment elevation acute myocardial infarction (STEMI, n = 27), and healthy controls (n = 28). We quantitatively confirmed up-regulation of miR-16 and miR-26a in patients with TTC compared with healthy subjects (both, P < 0.001), and up-regulation of miR-16, miR-26a, and let-7f compared with STEMI patients (P < 0.0001, P < 0.05, and P < 0.05, respectively). Consistent with previous publications, cardiac specific miR-1 and miR-133a were up-regulated in STEMI patients compared with healthy controls (both, P < 0.0001). Moreover, miR-133a was substantially increased in patients with STEMI compared with TTC (P < 0.05). A unique signature comprising miR-1, miR-16, miR-26a, and miR-133a differentiated TTC from healthy subjects [area under the curve (AUC) 0.835, 95% CI 0.733–0.937, P < 0.0001] and from STEMI patients (AUC 0.881, 95% CI 0.793–0.968, P < 0.0001). This signature yielded a sensitivity of 74.19% and a specificity of 78.57% for TTC vs. healthy subjects, and a sensitivity of 96.77% and a specificity of 70.37% for TTC vs. STEMI patients. Additionally, we noticed a decrease of the endothelin-1 (ET-1)-regulating miRNA-125a-5p in parallel with a robust increase of ET-1 plasma levels in TTC compared with healthy subjects (P < 0.05).
The present study for the first time describes a signature of four circulating miRNAs as a robust biomarker to distinguish TTC from STEMI patients. The significant up-regulation of these stress- and depression-related miRNAs suggests a close connection of TTC with neuropsychiatric disorders. Moreover, decreased levels of miRNA125a-5p as well as increased plasma levels of its target ET-1 are in line with the microvascular spasm hypothesis of the TTC pathomechanism.
Introduction
Takotsubo cardiomyopathy (TTC) is an increasingly recognized acute syndrome with symptoms similar to acute myocardial infarction (MI), including chest pain and electrocardiographic changes, mostly in the absence of obstructive coronary artery disease.1–5 The syndrome is often triggered by emotional or physical stress factors and comprises reversible wall motion abnormalities involving apical, midventricular, basal or focal segments of the left ventricle.6–8 Even if wall motion abnormalities usually resolve within few days to weeks and the overall prognosis is favourable,9–11 TTC remains a life-threatening disease in the acute phase, since 10% of the patients develop malignant arrhythmia, cardiogenic shock, or ventricular wall rupture12 with a mortality rate up to 8%.11,13–15 In the acute phase, TTC is indistinguishable from acute MI with respect to clinical symptoms, ECG changes, and cardiac biomarkers such as troponin, creatine kinase (CK), and CK-MB. Although the peak ratio of NT-proBNP/troponin has been described to distinguish patients with TTC and acute MI,16 fast and accurate diagnosis on admission remains challenging, and coronary angiography is still mandatory to exclude acute MI. Thus, there is a need for sensitive and specific biomarkers for the early diagnosis of TTC.
MicroRNAs (miRNAs/miRs) are a class of highly conserved, small (19–25 nucleotides) noncoding post-transcriptional regulators of diverse cellular processes including proliferation, angiogenesis, differentiation, and apoptosis.17 MicroRNAs have recently been considered as biomarkers in cardiovascular disease,18 i.e. in heart failure,19 stable coronary artery disease,20 and acute MI.21,22 Thus, we hypothesized that miRNAs may serve as sensitive and specific biomarkers in TTC allowing for immediate diagnosis. Therefore, we searched for circulating miRNAs regulated in the acute course of TTC.
Methods
Study population
Patients from the International Takotsubo Registry (www.takotsubo-registry.com) contributed from five collaborating centres (Zurich, Heidelberg, Gdansk, Lucerne, and Hannover) were included in the present study if they fulfilled the Mayo Clinic Diagnostic Criteria for TTC.6 For comparison, patients with ST-segment elevation acute myocardial infarction (STEMI) were included, based on the ESC/AHA/ACC guidelines.23,24 Healthy subjects were recruited after coronary angiography if coronary artery disease and preserved left ventricular ejection fraction were not present. All groups were age- and gender-matched and presented a similar cardiovascular risk profile.
Plasma samples were prospectively collected within 24 h after the onset of symptoms. Data on clinical presentation, precipitating factors, cardiovascular risk factors, medications, and demographics were obtained as well. Full recovery of wall motion abnormalities in TTC patients was documented by follow-up echocardiography. Baseline characteristics are shown in Table 1. The study adhered to the requirements of the local ethics committee. Written informed consent was obtained from all patients.
Baseline characteristics
| Variable | TTC (n = 36) | STEMI (n = 27) | Healthy (n = 28) | P-value |
|---|---|---|---|---|
| Age (years), mean (±SD) | 68.7 (±12.0) | 67.1 (±7.4) | 63.7 (±5.1) | 0.093 |
| Female gender, n (%) | 33 (92) | 23 (85) | 24 (86) | 0.680 |
| BMI, kg/m2 | 23.4 (±4.5) | 27.6 (±6.9) | 25.1 (±4.5) | 0.020 |
| LVEF (%), mean (±SD) | 40.7 (±10.3) | 47.1 (±11.3) | 60.5 (±3.1) | <0.001 |
| Cardiovascular risk factors | ||||
| Arterial hypertension, n (%) | 20 (56) | 17 (63) | 15 (54) | 0.648 |
| Hyperlipidaemia, n (%) | 7 (19) | 12 (44) | 10 (36) | 0.077 |
| Smoking, n (%) | 10 (28) | 9 (33) | 1 (4) | 0.007 |
| Diabetes mellitus, n (%) | 3 (8) | 3 (11) | 5 (18 | 0.519 |
| Positive family historya, n (%) | 11 (31) | 10 (37) | 6 (21) | 0.292 |
| Cardiovascular history | ||||
| Non-obstructive CADb | 6 (17) | 0 | 0 | |
| Obstructive CADc, n (%) | 3 (8) | 27 (100) | 0 | <0.001 |
| Re-animation, n (%) | 3 (8) | 6 (22) | 0 | 0.155 |
| Laboratory values on admission | ||||
| NT-proBNP (ng/L), median (IQR) | 449.0 (172.0–3065.0) | 396.4 (157.9–1479.8) | 145.0 (115.0–194.0) | 0.110 |
| Troponin (μg/L), median (IQR) | 0.3 (0.1–0.7) | – | – | – |
| hsTroponin (pg/mL), median (IQR) | 257.0 (74.5–267.0) | 350.0 (43.3–1545.0) | – | 0.361 |
| CK (U/L), median (IQR) | 149.0 (110.5–197.3) | 491.0 (208.3–1582.0) | 107.0 (73.5–157.0) | 0.002 |
| CKMB (U/L), median (IQR) | 14.0 (6.83–26.0) | 132.0 (19.5–255.0) | 14.0 (11.3–17.8) | <0.001 |
| Medication on admission | ||||
| ACE-inhibitor or ARB, n (%) | 11 (31) | 4 (15) | 13 (46) | 0.071 |
| Beta-blocker, n (%) | 11 (31) | 1 (4) | 11 (39) | 0.011 |
aDefined as a myocardial infarction in direct blood relatives of the patient (male <55 years; female <65 years).
bAtherosclerosis and lesions <50%.
cAt least one stenosis of ≥50%.
ACE, angiotensin-converting enzyme; ARB, angiotensin-receptor blocker; BMI, body mass index; CAD, coronary artery disease; CK, creatine kinase; CKMB, creatine kinase MB-isoenzyme; LVEF, left ventricle ejection fraction; NT-proBNP, N-terminal pro-hormone brain natriuretic peptide; STEMI, ST-segment elevation acute myocardial infarction; TTC, takotsubo cardiomyopathy; IQR, inter-quartile range.
Plasma collection and storage
In brief, blood samples were obtained from all patients in the cardiac catheterization laboratory. Blood was drawn into standard tubes containing ∼1.8 mg of K2EDTA per millilitre of blood (Vacutainer™, Beckton Dickinson, Franklin Lakes, NJ, USA). Immediate centrifugation was carried out for 15 min at 1300 g at room temperature. Supernatant was aspirated, centrifuged, aliquoted into RNase/DNase-free cryovials, and stored at –80°C until assayed.
RNA isolation and detection
RNA was isolated from 100 µL of plasma with the MiRNeasy Isolation Kit (Qiagen, Hilden, Germany) according to the manufacturer's instructions. Five microlitres of 1 fmol/µL Caenorhabditis elegans miR-39 (cel_miR-39) was supplemented as an internal standard before starting the isolation procedure.25
MicroRNA array and validation
For the screening of differentially regulated miRNAs, five RNA samples of each group were pooled and miRNA expression was measured by TaqMan® Human MicroRNA Card A and B Array, version 2.0 (Applied Biosystems®, Foster City, CA, USA) containing probes for a total of 667 human miRNAs. According to array results and literature, candidate miRNAs were chosen for further validation with reverse transcription polymerase chain reaction (RT–PCR). Complementary DNA was synthesized using the Reverse Transcription TaqMan MicroRNA Reverse Transcription Kit (Applied Biosystems®) according to the manufacturer's instructions. Quantitative RT–PCR (qRT–PCR) was performed with specific TaqMan miRNA assays (Applied Biosystems®) for quantification of miR-1, miR-16, miR-26a, miR-125a-5p, miR-133a, miR-519d, let-7f, and cel_miR-39. Results were normalized to the amount of cel_miR-39 as described previously.26 Quantitative determination of miRNAs was calculated using the standard curve method.
Measurement of endothelin-1
Plasma levels of endothelin-1 (ET-1) were determined in 75 µL of plasma using a commercially available quantitative sandwich enzyme immunoassay (Quantikine™, R&D Systems, Abingdon, UK).
Statistical analysis
Values are expressed as mean ± SEM or median with inter-quartile range (IQR). Shapiro–Wilk and Kolomogorov–Smirnov tests were used to test for non-Gaussian distribution. Student's two-sided t-test or one-way ANOVA, followed by Bonferroni's multiple comparison test as a post hoc analysis, was used for normally distributed values. For variables without normal distribution, Mann–Whitney U test or Kruskal–Wallis test was performed. Receiver operating characteristic curves were analysed to assess specificity and sensitivity of single-plasma miRNAs and their combination using multiple logistic regression analysis. The optimal diagnostic point of the signature was assessed at cut-off values with the largest Youden's index (sensitivity + specificity − 1). To investigate the clinical impact of our signature miRNAs, we have chosen the likelihood ratio (LR) in addition to classical test parameters—sensitivity and specificity, because it combines information of both. Odds ratio per standard deviation was calculated by logistic regression analysis.
Statistical analyses were performed using IBM SPSS Statistics 20 (SPSS, Inc., Chicago, IL, USA), SAS 9.3 (SAS Institute, Inc., USA), and GraphPad Prism 5. The following values were considered significant: P < 0.05 (*), P < 0.01 (**), and P < 0.001 (***).
Results
MicroRNA array
MicroRNA array screening revealed let-7f, miR-22, and miR-519d as the most significantly up-regulated miRNAs in the TTC group compared with healthy controls. Moreover, we detected a dysregulation of miR-16 and miR-26a, recently described as stress- and depression-related miRNAs. In addition, miR-125a-5p, which is a potential regulator of ET-1 expression in vascular endothelial cells, was down-regulated in the miRNA array (Figure 1).
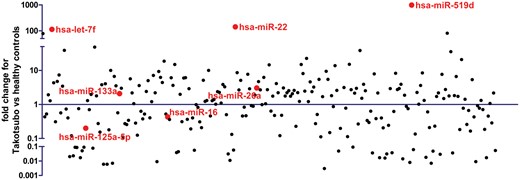
MicroRNA array profiling in patients with takotsubo cardiomyopathy compared with healthy subjects. Red colour indicates microRNA candidates considered for the real-time quantitative reverse transcription polymerase chain reaction validation. miR-1 was not detectable in healthy subjects and, therefore, not presented here.
All above-mentioned miRNAs were considered for further validation together with miR-1 and miR-133a, two miRNAs well-known to be increased after MI.21,22,27
Validation of microRNAs
Using cel-miR-39 as normalization control, we notified a significant induction of miR-16 and miR-26a, both previously described in stress response,28,29 in TTC patients compared with healthy controls (both, P < 0.001) and STEMI patients (P < 0.0001 and P < 0.05, respectively; Figure 2). In addition, let-7f was significantly up-regulated in TTC patients compared with STEMI patients (P < 0.05, Figure 2). There was no significant difference in miR-22 expression between groups (Figure 2), and miR-519d could not be detected in several samples; therefore, both were omitted for further analysis (Figure 2).
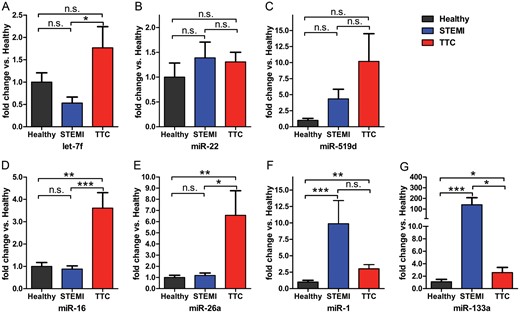
Comparative analysis of expression levels for selected microRNA candidates for takotsubo cardiomyopathy, ST-segment elevation acute myocardial infarction, and healthy controls; *P < 0.05, **P < 0.001, ***P < 0.0001.
miR-1 and miR-133a, both previously described to be associated with MI, were up-regulated in STEMI patients compared with healthy controls (both, P < 0.0001), confirming previously published data.21,22,27 miR-133a was substantially increased in patients with STEMI compared with those with TTC (P < 0.05). Interestingly, both miR-1 and miR-133a were also significantly up-regulated in patients with TTC compared with healthy controls (P < 0.001 and P < 0.05, respectively). However, absolute expression levels did not reach values of STEMI samples.
MicroRNA signature for the identification of patients with takotsubo cardiomyopathy
miR-16, miR-26a, miR-1, and miR-133a were significantly up-regulated in TTC patients compared with healthy controls (Figure 2). However, the area under the curve (AUC) was ≤0.779 for each single-miRNA to predict TTC (Figure 3, Table 2). Combinations of two miRNAs slightly increased the AUC to 0.792, whereas the combination out of three miRNAs pushed the AUC in TTC to healthy subjects to a maximum of 0.824 by OR per SD of 4.221 (95% CI 1.956–9.109) and in TTC to STEMI to a maximum of 0.879 by OR per SD of 8.739 (95% CI 2.271–27.559).
Receiver operating characteristic curves
| AUC | 95% CI | P-value | OR per SD | 95% CI | Cut off | Sensitivity (%) | 95% CI | Specificity (%) | 95% CI | LR+ | LR− | |
|---|---|---|---|---|---|---|---|---|---|---|---|---|
| TTC vs. healthy | ||||||||||||
| miR-16 | 0.762 | 0.643–0.881 | <0.001 | 3.093 | 1.594–6.002 | >0.872 | 68.75 | 49.99–83.88 | 75.00 | 55.13–89.31 | 2.75 | 0.42 |
| miR-26a | 0.725 | 0.589–0.860 | <0.01 | 4.812 | 2.272–10.192 | >0.415 | 61.29 | 42.19–78.15 | 89.29 | 71.77–97.73 | 5.72 | 0.43 |
| miR-1 | 0.779 | 0.658–0.900 | <0.001 | 3.314 | 1.656–6.632 | >4.359 | 81.25 | 63.56–92.79 | 75.00 | 55.13–89.31 | 3.25 | 0.25 |
| miR-133a | 0.757 | 0.629–0.884 | <0.001 | 2.379 | 1.324–4.276 | >0.438 | 68.75 | 49.99–83.88 | 78.57 | 59.05–91.70 | 3.21 | 0.40 |
| miR-16+miR-26a | 0.773 | 0.655–0.892 | <0.001 | 3.098 | 1.581–6.071 | >0.460 | 58.06 | 39.08–75.45 | 89.29 | 71.77–97.73 | 5.42 | 0.47 |
| miR-1+miR-133a | 0.792 | 0.673–0.911 | <0.001 | 3.100 | 1.623–5.921 | >0.020 | 81.25 | 63.56–92.79 | 78.57 | 59.05–91.70 | 3.79 | 0.24 |
| miR-16+miR-26a+miR-1 | 0.824 | 0.718–0.929 | <0.0001 | 4.221 | 1.956–9.109 | >−0.350 | 83.87 | 66.27–94.55 | 71.43 | 51.33–86.78 | 2.94 | 0.23 |
| miR-16+miR-26a+miR-133a | 0.805 | 0.695–0.916 | <0.0001 | 3.339 | 1.694–6.579 | >0.026 | 77.42 | 58.90–90.41 | 71.43 | 51.33–86.78 | 2.71 | 0.32 |
| Signaturea | 0.835 | 0.733–0.937 | <0.0001 | 2.457 | 1.440–4.192 | >0.511 | 74.19 | 55.39–88.14 | 78.57 | 59.05–91.70 | 3.46 | 0.33 |
| TTC vs. STEMI | ||||||||||||
| miR-16 | 0.777 | 0.660–0.893 | <0.001 | 3.524 | 1.666–7.452 | >0.866 | 68.75 | 49.99–83.88 | 81.48 | 61.92–93.70 | 3.71 | 0.38 |
| miR-26a | 0.700 | 0.561–0.839 | <0.01 | 3.824 | 1.887–7.753 | >0.684 | 48.39 | 30.15–66.94 | 96.30 | 81.03–99.91 | 13.1 | 0.54 |
| miR-1 | 0.644 | 0.496–0.790 | 0.06 | 0.896 | 0.531–1.511 | < 13.41 | 75.0 | 56.59–88.54 | 59.26 | 38.80–77.61 | 1.84 | 0.42 |
| miR-133a | 0.751 | 0.615–0.887 | <0.001 | 0.358 | 0.189–0.679 | <2.473 | 90.63 | 74.98–98.02 | 62.96 | 42.37–80.60 | 2.45 | 0.15 |
| miR-16+miR-26a | 0.786 | 0.670–0.902 | <0.001 | 3.564 | 1.679–7.562 | >0.277 | 70.97 | 51.96–85.78 | 81.48 | 61.92–93.70 | 3.83 | 0.36 |
| miR-1+miR-133a | 0.770 | 0.637–0.903 | <0.001 | 3.552 | 1.868–6.757 | >0.186 | 84.38 | 67.21–94.72 | 70.37 | 49.82%–86.25 | 2.85 | 0.22 |
| miR-16+miR-26a+miR-1 | 0.863 | 0.772–0.953 | <0.0001 | 5.104 | 2.188–11.908 | >−0.948 | 96.77 | 83.30–99.92 | 59.26 | 38.80–77.61 | 2.38 | 0.05 |
| miR-16+miR-26a+miR-133a | 0.879 | 0.792–0.967 | <0.0001 | 8.739 | 2.771–27.559 | >−0.381 | 93.55 | 78.58–99.21 | 70.37 | 49.82–86.25 | 3.16 | 0.09 |
| Signaturea | 0.881 | 0.793–0.968 | <0.0001 | 5.495 | 2.391–12.629 | >0.385 | 96.77 | 83.30–99.92 | 70.37 | 49.82–86.25 | 3.27 | 0.05 |
AUC, area under the curve; CI, confidence interval; LR+, positive likelihood ratio; LR−, negative likelihood ratio; miR, microRNA; OR, odds ratio per standard deviation; STEMI, ST-segment elevation acute myocardial infarction; TTC, takotsubo cardiomyopathy.
amiR-16+miR-26a+miR-1+miR-133a.
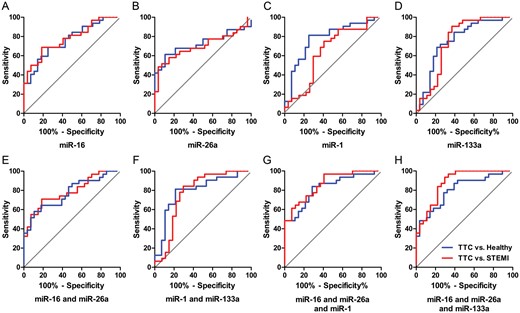
ROC curve analysis for single microRNAs (A: miR-16; B: miR-26a; C: miR-1; D: miR-133a) and combinations (E: miR-16+miR-26a; F: miR-1+miR-133a; G: miR-16+miR-26a+miR-1; H: miR-16+miR-26a+miR-133a) to discriminate takotsubo cardiomyopathy from healthy controls and ST-segment elevation acute myocardial infarction patients.
Notably, the combination of all four miRNAs resulted in a robustly increased AUC, leading to a signature for the prediction of TTC (Figure 4, Table 2). Multiple logistic regression analysis revealed an AUC of 0.835 (95% CI 0.733–0.937) by OR per SD of 2.457 (95% CI 1.440–4.192) when comparing the signature of TTC to healthy subjects and 0.881 (95% CI 0.793–0.968) by OR per SD of 5.495 (95% CI 2.391–12.629) comparing the combination of miRNAs of TTC with STEMI patients.
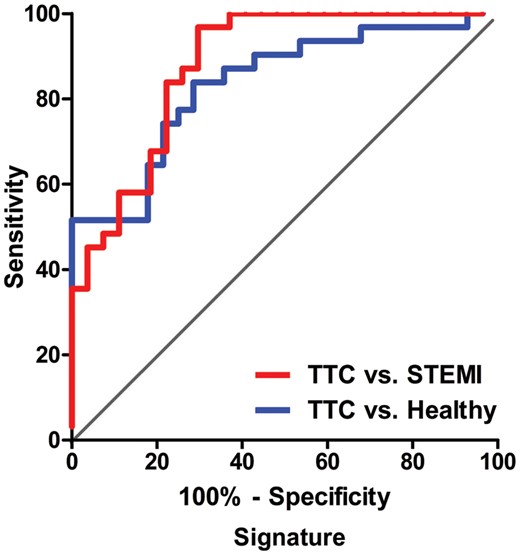
ROC curve analysis for the combination of four microRNAs resulting in enhanced specificity and sensitivity to distinguish takotsubo cardiomyopathy form healthy subjects (74.2, 78.6%, respectively) and ST-segment elevation acute myocardial infarction controls (96.8, 70.4%, respectively).
In contrast to the independent cut-off values between TTC and healthy subjects for every miRNA (>0.872 for miR-16, >0.415 for miR-26a, >4.359 for miR-1, and >0.438 for miR-133a), a global cut-off value of >0.511 for all signature miRNAs pushed the diagnostic power to a 74.19% sensitivity and a 78.57% specificity for the differentiation. Accordingly, despite the single-miRNA cut-off values between TTC and STEMI (>0.866 for miR-16, >0.684 for miR-26a, <13.410 for miR-1, and <2.473 for miR-133a), a global cut-off value of >0.385 for all signature miRNAs increased the diagnostic power to a 96.77% sensitivity and a 70.37% specificity (Table 2).
miRNA-125a-5p and endothelin-1 expression
Validation of miR-125a-5p revealed a strong although not formally significant down-regulation in patients with TTC compared with healthy subjects. Levels of ET-1, a commonly known target of miR-125a-5p, were significantly increased in patients with TTC, suggesting a potential role of the miR-125a-5p-ET-1 axis in TTC pathogenesis (Figure 5).
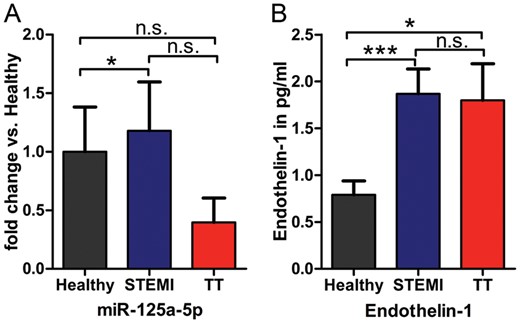
Results of the quantitative reverse transcription polymerase chain reaction of the miR-125a-5p expression (A) and endothelin-1 assay (B) in takotsubo cardiomyopathy, ST-segment elevation acute myocardial infarction and healthy subjects; *P < 0.05, ***P < 0.0001.
Discussion
This study for the first time reports (i) a novel signature of four circulating miRNAs allowing to distinguish TTC from STEMI patients in an acute setting; (ii) that stress- and depression-related miRNAs are up-regulated in this setting in line with known triggers of TTC; and (iii) that ET-1, a possible mediator of myocardial ischaemia in TTC, is produced at increased amounts in parallel to an down-regulation of the ET-1-regulating miRNA125a-5p. Thus, this study provides novel insights into both the diagnosis and pathogenesis of TTC.
Biomarkers remain an essential tool in daily clinical practice for diagnosis, risk prediction, and therapeutic decision-making, particularly in the emergency setting. Biomarkers also contribute to the understanding of the pathomechanisms of a given disease. Takotsubo cardiomyopathy essentially mimics acute MI in clinical presentation and a profile of common cardiac necrosis biomarkers that hampers a rapid diagnosis.16 Today, no biomarker exists to differentiate TTC from MI in the acute phase. Sampling of circulating plasma miRNAs represents a potential new approach for non-invasive and rapid diagnostic screening using polymerase chain reaction.18 In the present study, we identified for the first time a unique signature of differentially regulated miRNAs distinguishing patients with TTC from those with STEMI (sensitivity 96.77%, specificity 70.37%) and healthy subjects (sensitivity 74.19%, specificity 78.57%). The predictive accuracy of our miRNA signature distinguishing TTC from STEMI patients and healthy subjects was similar to those recently published to differentiate acute MI from non-MI patients.22,30
MicroRNAs in acute myocardial infarction
In line with the current literature, our results confirm that miRNAs are differentially regulated in patients with acute MI. Serum levels of miR-1, miR-133a/b, miR-208a/b, and miR-499–5p are altered in patients with acute MI.21,22,27,31 The most commonly reported miRNAs for the identification of acute MI are miR-1 and miR-133a. Interestingly, serum levels of miR-1, -133a, and -133b reach peak concentrations before troponin during acute MI in humans.21 Moreover, miR-1 and miR-133a have recently been shown to be also slightly increased in patients with unstable angina and TTC.32 This result is consistent with our observation that miR-1 and miR-133a expression is strongly up-regulated in STEMI patients and only weakly increased in TTC patients.
Of note, in our study, miR-1 and miR-133a strengthen our signature to distinguish patients with TTC and STEMI. Therefore, miR-1 and miR-133a are obviously not general markers of acute cardiac disease, but differentially respond depending on the underlying diagnosis.
MicroRNAs and neurological and psychiatric insights of stress
A particularly interesting finding was that—in addition to the related miRNAs miR-1 and miR-133a21,22,27—this unique miRNA signature included miR-16 and miR-26a, both known as stress- and depression-related miRNAs that appear to play a key role in the stress response to sudden environmental changes.28,29,33–35 The fact that this psychological stress response is potentially detectable in peripheral blood has already been described.29 Indeed, miR-16 is altered in healthy Japanese medical students after an acute stress stimulus29 and is, therefore, thought to be part of a general stress response in healthy subjects.29 Furthermore, miR-26a is overexpressed in brain tissue of stressed mice.28 Thus, these findings are well in line with the known high incidence of psychosocial or mental triggers preceding the TTC event and could indicate potential psychiatric co-morbidities in these patients.36,37 Frequent episodes of depression and anxiety have been implicated as potential risk factors predisposing to TTC.38
The power of the signature
Our receiver operating characteristic curves (Table 2) revealed that the power of diagnostic test for TTC was associated with the number of linked miRNAs in our signature. Although already one miRNA could discriminate to AUC of 0.779 between the different groups, this approach failed in appropriate LR and OR per SD. Every additionally added miRNA prooved to increase AUC as also LR and OR per SD. Only the combination of four miRNAs managed to deliver an increased discrimination (AUC 0.881) with a high positive LR in accordance with a low negative LR in combination with an appropriate OR per SD with a narrow 95% CI (Table 2, signature values). This increased diagnostic power is provided by a global cut-off value for all signature miRNAs, combining the advantages of different miRNA expression values and physiological regulation of certain miRNAs. Hence, we are able not only to show one biomarker—in terms of miRNA regulation, we are now able to show a network of associated regulation in TTC. In all other set-ups (one, two, or three combined miRNAs), we recognized either high positive LR linked with high negative LR or otherwise. Additionally, the OR per SD either failed in its value or in its appropriate narrow 95% CI when compared with our signature.
Microvascular vasoconstriction and takotsubo cardiomyopathy
The exact aetiology of TTC is still unknown; however, numerous potential mechanisms have been proposed.39 Although exaggerated sympathetic stimulation and alterations of the coronary microcirculation have been described, no causal relationship has been demonstrated so far.40
Endothelin-1 represents one of the most potent vasoconstrictors being 100 times more potent than norepinephrine.41–43 This vasoconstriction is induced via an ultimate acceleration of calcium influx through voltage-dependent calcium channels. High levels of ET-1 after MI are associated with microvascular obstruction and lower myocardial salvage index.44 miR-125a-5p inhibits ET-1 expression in vascular endothelial cells and targets the regions within the 3′-UTR for the transcript for prepro-ET-1, which is highly conserved in humans. Therefore, miR-125a-5p may play an essential role as a novel regulator of vasomotor homeostasis.45 Since we have shown a tendency towards down-regulation of miR-125a-5p expression in TTC patients compared with healthy subjects, we subsequently measured ET-1. Notably, ET-1 was significantly increased in plasma samples of patients with TTC. Therefore, a potential role of ET-1 as a mediator of microvascular spasm in TTC can be speculated. The high levels of ET-1 in STEMI patients may be explained by the presence of no-reflow46 or reperfusion of ischaemic myocardium.47
The following limitations have to be acknowledged: first, the clinical applicability of the presented results can be limited by the time required for the determination of signature, the cost of assessment, and the difficulty to have appropriate laboratory facilities in small centres. However, on the opposite, the identification of distinct biomarker signatures could represent a possible perspective advancement to aid and exclude for other possible player of differential diagnosis, i.e. acute myocarditis. Furthermore, currently, novel faster approaches for the quantification of circulating miRNAs, e.g. by high-performance liquid chromatography, are under development that will likely lead to a fast detection system in the future.
We demonstrate for the first time a unique signature of circulating miRNAs to differentiate TTC from STEMI patients. However, these results need to be confirmed in a large patient cohort to exclude potential bias. Therefore, further investigations should be obtained to affirm the performance of the signature proposed here.
Conclusion
Here, we, for the first time, describe a signature of circulating miRNAs for sensitive and specific identification of TTC in the acute phase. This signature may hold great promise to become an important diagnostic tool for the immediate diagnosis of TTC. The significant up-regulation of stress- and depression-related miRNAs suggests a role of central and/or peripheral nervous system in TTC. Furthermore, our findings suggest that ET-1 may play a role in the pathomechanism of TTC.
Funding
The study was supported by research grants of the Swiss National Research Foundation [Special Programme University Medicine ‘Acute Coronary Syndromes and Inflammation’ (Nr. 33CM30 - 124112/1 to T.F.L.)], Biosensors Europe SA, Morges, Switzerland, Prof. Otto Beisheim Foundation and Mach-Gaensslen Foundation to C.T., and the European Commission within the FP7 programme, grant agreement 305501 (HOMAGE) to T.T. Furthermore, a research grant of the European Society of Cardiology to M.J. supported this work.
Conflict of interest: none declared.
References
Author notes
These authors contributed equally to this work.
This paper was guest edited by Prof. Stefano Taddei

