


Abstract
The prognostic implications of blood glucose on a wide range of outcomes including early mortality, hospitalizations, and incident diabetes diagnoses have not been fully elucidated in acute heart failure syndromes (AHFS).
In a population-based cohort of 16 524 AHFS patients presenting to the emergency department (ED) in Ontario, Canada between 2004 and 2007, we performed a competing risk analysis for 30-day mortality, new diabetes diagnoses, and hospitalization outcomes. Presentation blood glucose concentrations were categorized as follows: 3.9–6.1 [referent], >6.1–7.8, >7.8–9.4, >9.4–11.1, and >11.1 mmol/L.
Among AHFS patients without diabetes presenting to the ED (n = 9275), blood glucose >6.1 mmol/L (n = 5252, 56.6%) was associated with increased risks of all-cause death [hazard ratio (HR) range: 1.26 (95% CI 1.05–1.50) to 1.50 (95% CI 1.11–2.02)], and cardiovascular death [HR range: 1.28 (95% CI 1.03–1.59) to 1.64 (95% CI 1.16–2.33)]. Among AHFS patients with diabetes (n = 7249), presenting blood glucose >11.1 mmol/L (n = 2286, 31.5%) was associated with increased risks of all-cause death (HR 1.48, 95% CI 1.10–2.00) and diabetes-related hospitalizations (HR 1.39, 95% CI; 1.20–1.61). Presentation blood glucose >9.4 mmol/L was associated with increased risks of hospitalization for HF or cardiovascular causes [HR range: 1.09 (95% CI 1.02–1.17) to 1.15 (95% CI 1.07–1.24)] in all patients. With higher presentation blood glucose, the risk of incident diabetes diagnosis increased, with adjusted HRs of 1.61 (>6.1–7.8 mmol/L) to 3.61 (>11.1 mmol/L) among those without the condition at baseline (all P < 0.001).
Mildly elevated presentation blood glucose was associated with early death, future diabetes, and hospitalizations for diabetes, HF, and cardiovascular causes among patients with AHFS.
Introduction
Acute heart failure syndromes (AHFS) account for a substantial number of emergency department (ED) visits annually1 and are associated with high short- and long-term mortality rates.2 At the time of presentation, patients with AHFS may demonstrate a wide spectrum of physiological and metabolic perturbations such as hyperglycaemia, which can occur in up to 40% of patients irrespective of pre-existing diabetes status.3,4
In patients hospitalized for acute myocardial infarction (AMI), hyperglycaemia is a marker for short-term mortality.5 The detrimental effects of hyperglycaemia on the ischaemic myocardium act via a shift towards anaerobic myocardial metabolism through enhanced free-fatty acid utilization and impaired glucose utilization,6 increased mitochondrial oxidative stress6 and endothelial dysfunction.7 However, attempts to extend the association of blood glucose with mortality, observed among patients with AMI, to those with AHFS have been challenging.3,4
Despite the potential challenges, if blood glucose measurement is prognostically useful, it may be of broad potential utility because it is a rapid, readily available, and inexpensive test that can be used in the acute setting to allow rapid risk stratification for a wide range of potential outcomes and screening strategies. For these reasons, we analysed the early mortality, hospitalization, and future diabetes risk associated with presentation blood glucose in a population-based cohort of AHFS patients.
Methods
Patient selection
Patients aged ≥18 years residing in Ontario, Canada, who presented to an ED with a primary diagnosis of HF were eligible for study inclusion. Clinical data were abstracted from two complementary studies and combined in the present analysis: (i) hospitalized HF patients admitted between 1 April 2004 and 31 March 2005 in the Enhanced Feedback For Effective Cardiac Treatment (EFFECT) Phase 2 study8 and (ii) patients who were either discharged from the ED or hospitalized between 1 April 2004 and 31 March 2007 in the Emergency Heart Failure Mortality Risk Grade (EHMRG) study.9
Included patients were required to (i) meet Framingham HF criteria10 and (ii) have a primary diagnosis of HF using the International Classification of Diseases, 10th revision (ICD-10-CA code I50) in the ED or hospital discharge abstract. In the event of repeat visits, the initial hospital presentation was considered the index hospital visit. Research ethics approval was obtained from Sunnybrook Health Sciences Center.
Data sources
The EFFECT and EHMRG clinically abstracted data were anonymously linked to validated administrative databases using the patients' unique, encrypted health insurance number. We obtained information on ED visits from the National Ambulatory Care Reporting System and hospitalizations from the Canadian Institute for Health Information Discharge Abstract Database (CIHI-DAD). All-cause deaths were identified from the Registered Persons Database and cardiovascular mortality was identified from the Ontario Registrar General's vital statistics database. The accuracy of these databases has been previously described.11–13 Patients were stratified into those with or without pre-existing diabetes using the Ontario Diabetes Database, a validated registry which tracks incident and prevalent patients diagnosed with diabetes in the population.14 The Ontario Diabetes Database has sensitivity 86% and specificity 97% for identifying prevalent14 and incident diabetes patients.15
Definitions and outcomes
We examined the first serum blood glucose measurement drawn upon ED presentation. Patients whose initial blood glucose measurements were obtained >24 h after presentation were excluded. To ensure a homogeneous cohort, patients with initial blood glucose readings at the upper (>33.3 mmol/L) or lower (<3.9 mmol/L) extremes of value were excluded from the analysis, as previously categorized.3 Patients were subsequently classified according to previously defined blood glucose strata: 3.9–6.1 (referent), >6.1–7.8, >7.8–9.4, >9.4–11.1, and >11.1 mmol/L.3
We examined death occurring within 30 days and 1-year after ED presentation and longer-term morbidity outcomes after index hospital separation (i.e. ED or hospital discharge). Morbidity outcomes occurring from index hospital separation until 31 March 2012 included: (i) cardiovascular readmissions in all patients with or without diabetes, (ii) HF readmissions in all patients, (iii) diabetes-related hospitalizations among patients with pre-existing diabetes, and (iv) de novo diagnosis of diabetes among those without pre-existing diabetes.
Cardiovascular hospitalizations included admissions for ischaemic heart disease, HF, or other cardiovascular conditions. HF-specific hospitalizations included admissions where HF was the primary diagnosis. As shown in Supplementary material online, Appendix S1, diabetes-related hospitalizations included hospital admissions for hyperglycaemia or hypoglycaemia, skin and soft-tissue infections, and lower extremity amputations not related to malignancy or trauma.16 Elective hospital admissions with length of stay of ≤1 day were not counted as an outcome event in hospitalization analyses.
Statistical analysis
Continuous variables were expressed as medians with interquartile range (IQR: 25th, 75th percentiles) and compared using the Kruskal–Wallis test. Categorical variables were compared using the χ2 test. We used multiple Cox regression models to estimate the hazard ratios (HRs) for the independent risk of the occurrence of all-cause mortality, adjusting for clinical variables including those comprising the EHMRG and EFFECT HF risk scores, sex, pre-admission medication use (i.e. HMG-coA reductase inhibitor, β-adrenoreceptor antagonist, furosemide, angiotensin converting enzyme (ACE) inhibitor, angiotensin receptor blocker, and spironolactone), and other cardiac and non-cardiac conditions.2,9 We also adjusted for administrative data-derived comorbidity models (see Supplementary material online, Appendix S2) by scanning all diagnosis codes in the CIHI-DAD within 1 year before the index HF admission.17 In a similar fashion, Cox proportional hazards regression models were used to model the effect of presentation blood glucose on the cause-specific hazard of the following outcomes: (i) cardiovascular death (treating non-cardiovascular death as a competing risk) and (ii) hospitalizations or de novo diabetes diagnosis (treating death as a competing risk). We also assessed the reclassification of mortality risk with presentation blood glucose by examining continuous net reclassification improvement (NRI).18
To estimate the magnitude of de novo diabetes, we determined the number of persons in each presentation blood glucose category for every new diabetes diagnosis at 5-year follow-up. Specifically, we used the formula 1/(Pc − Pt), where Pc represents the percentage of de novo diabetes diagnoses in patients with a blood glucose 3.9–6.1 mmol/L and Pt, the percentage of patients with de novo diabetes in the category of interest, essentially estimating the number needed to harm.19 Hospital admission rates were calculated per 100 patient-years and 95% confidence intervals (95% CI) were determined using the γ distribution.20 Marginal cumulative incidence functions (CIFs) were constructed to illustrate adjusted differences in diabetes incidence between different levels of blood glucose, and a Fine-Gray competing risk regression model was used to model the incidence of diabetes, accounting for the competing risk of mortality.21 Using the fitted regression model, the CIF for diabetes was computed for each subject in the population, assuming that each subject was in the lowest glucose level. The estimated CIFs were averaged over all subjects, and then repeated for each of the different levels of glucose. This allows for comparison of diabetes incidence between populations that differ in glucose levels, but in which the distribution of all other baseline covariates is identical. Missing left ventricular ejection fraction (LVEF ≤45 vs. >45%) was imputed using a previously validated model.22 A two-sided P-value of <0.05 was considered statistically significant. All analyses were performed using SAS 9.3 (SAS Institute, Inc., Cary, NC, USA).
Results
Study cohort
Amongst 19 151 HF patients who were either hospitalized or discharged from the ED, the final study cohort comprised 16 524 unique patients (Figure 1). Median age of the cohort was 79 (70–85) years, 8115 (49%) were men, and 9275 (56%) did not have pre-existing diabetes (baseline characteristics, Table 1). There were 5086 (70%) patients with and 3122 (34%) without pre-existing diabetes whose presentation blood glucose value exceeded 7 mmol/L. The median presentation blood glucose was 8.9 (6.7–12.2) mmol/L in diabetes patients and 6.4 (5.6–7.6) mmol/L in non-diabetes patients (see Supplementary material online, Appendix Figure).
Baseline characteristics
| Pre-existing diabetes (N = 7249) | No pre-existing diabetes (N = 9275) | P-value | |
|---|---|---|---|
| Patient characteristics | |||
| Age (years) | 76 (68–82) | 81 (73–86) | <0.001 |
| Weight (kg) | 82 (68–95) | 72 (60–84) | <0.001 |
| Men, n (%) | 3826 (52.8%) | 4289 (46.2%) | <0.001 |
| Transported by EMS, n (%) | 3323 (45.8%) | 4207 (45.4%) | 0.537 |
| Presenting features | |||
| Systolic blood pressure (mmHg) | 146 (126–168) | 141 (123–163) | <0.001 |
| Diastolic blood pressure (mmHg) | 76 (65–89) | 78 (67–90) | <0.001 |
| Heart rate (beats/min) | 86 (71–102) | 88 (72–105) | <0.001 |
| Respiratory rate (breath/min) | 22 (20–28) | 22 (20–26) | 0.004 |
| Oxygen saturation (%) | 95 (91–97) | 95 (92–97) | 0.023 |
| Comorbidities, n (%) | |||
| Previous HF hospitalization | 2568 (35.4%) | 2573 (27.7%) | <0.001 |
| Myocardial infarction | 1237 (17.1%) | 1125 (12.1%) | <0.001 |
| Coronary artery disease | 4243 (58.5%) | 4399 (47.4%) | <0.001 |
| Previous coronary revascularizationa | 1746 (24.1%) | 1458 (15.7%) | <0.001 |
| Current smoker | 638 (8.8%) | 861 (9.3%) | 0.285 |
| Anaemia | 343 (4.7%) | 365 (3.9%) | 0.012 |
| Chronic lung disease | 1582 (21.8%) | 2075 (22.4%) | 0.400 |
| Hypertension | 5022 (69.3%) | 5320 (57.4%) | <0.001 |
| Stroke or transient ischaemic attack | 1325 (18.3%) | 1548 (16.7%) | 0.008 |
| Peripheral vascular disease | 1019 (14.1%) | 840 (9.1%) | <0.001 |
| Cirrhotic liver disease | 142 (2.0%) | 117 (1.3%) | <0.001 |
| Cognitive impairment | 573 (7.9%) | 1012 (10.9%) | <0.001 |
| Cancer | 753 (10.4%) | 1210 (13.0%) | <0.001 |
| Dialysis | 195 (2.7%) | 155 (1.7%) | <0.001 |
| LVEF | |||
| ≤45% | 3857 (53.2%) | 4389 (47.3%) | <0.001 |
| >45% | 3339 (46.1%) | 4820 (52.0%) | |
| Laboratory features | |||
| Haemoglobin (g/L) | 120 (107–134) | 126 (112–139) | <0.001 |
| Sodium (mmol/L) | 139 (136–141) | 139 (136–142) | <0.001 |
| Potassium (mmol/L) | 4 (4–5) | 4 (4–5) | <0.001 |
| Creatinine (µmol/L) | 111 (86–154) | 101 (81–132) | <0.001 |
| Non-normal troponin, n (%)b | 1117 (15.4%) | 1080 (11.6%) | <0.001 |
| Electrocardiographic features | |||
| Atrial fibrillation/flutter, n (%) | 1854 (25.6%) | 3009 (32.4%) | <0.001 |
| QRS duration (ms) | 100 (88–129) | 100 (86–130) | 0.001 |
| Cardiac medications pre-admission, n (%) | |||
| ACE inhibitor or ARB | 4650 (64.1%) | 4666 (50.3%) | <0.001 |
| β-Adrenoreceptor antagonist | 3609 (49.8%) | 3890 (41.9%) | <0.001 |
| Digoxin | 1381 (19.1%) | 1681 (18.1%) | 0.128 |
| Furosemide | 4110 (56.7%) | 4386 (47.3%) | <0.001 |
| Metolazone | 173 (2.4%) | 115 (1.2%) | <0.001 |
| Spironolactone | 666 (9.2%) | 712 (7.7%) | <0.001 |
| Antiplatelet agent (aspirin or clopidogrel) | 3263 (45.0%) | 3471 (37.4%) | <0.001 |
| Warfarin | 1952 (26.9%) | 2575 (27.8%) | 0.232 |
| HMG-coA reductase inhibitor | 3607 (49.8%) | 2858 (30.8%) | <0.001 |
IQR, interquartile range; EMS, emergency medical services; ARB, angiotensin receptor blocker; HMG-coA, 5-hydroxy-3-methylglutaryl-coenzyme A.
aPercutaneous coronary intervention or coronary artery bypass graft surgery.
bGreater than the upper limit of normal.
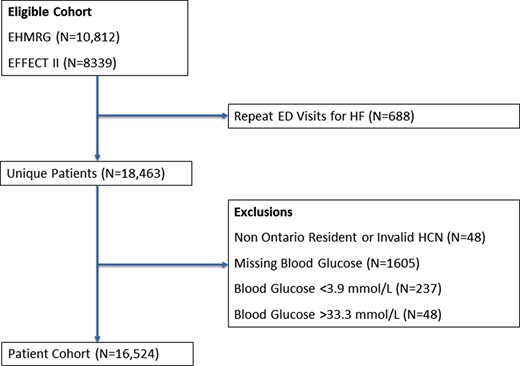
Patient flow diagram.
Association between presentation blood glucose and mortality
Among diabetes patients, a presentation blood glucose exceeding 11.1 mmol/L was associated with significantly increased risk of all-cause mortality compared with blood glucose 3.9–6.1 mmol/L. The adjusted HR was 1.48 (95% CI 1.10–2.00) as shown in Table 2 (P = 0.010). Compared with the EHMRG risk score, there was 15.1% improvement in NRI for 30-day mortality among those with diabetes; however, the confidence limits crossed zero (95% CI −3.8, 38.5%).
Association between presentation blood glucose and 30-day mortality
| Group | Outcome | Presentation blood glucose (mmol/L) | Events/patients | Rate per 100 pyrs (95% CI) | Adjusted HR (95%CI) | P-value |
|---|---|---|---|---|---|---|
| Pre-existing diabetes | All-cause mortality | 3.9–6.1 | 81/1271 | 6.4 (5.1–7.9) | Referent | NA |
| >6.1–7.8 | 105/1457 | 7.2 (5.9–8.7) | 1.13 (0.82–1.56) | 0.446 | ||
| >7.8–9.4 | 78/1254 | 6.2 (4.9–7.8) | 1.21 (0.86–1.70) | 0.284 | ||
| >9.4–11.1 | 56/981 | 5.7 (4.3–7.4) | 0.96 (0.66–1.39) | 0.821 | ||
| >11.1 | 196/2286 | 8.6 (7.4–9.9) | 1.48 (1.10–2.00) | 0.010 | ||
| Cardiovascular mortality | 3.9–6.1 | 44/1271 | 3.5 (2.5–4.7) | Referent | NA | |
| >6.1–7.8 | 62/1457 | 4.3 (3.3–5.5) | 1.21 (0.80–1.83) | 0.373 | ||
| >7.8–9.4 | 46/1254 | 3.7 (2.7–4.9) | 1.16 (0.74–1.82) | 0.517 | ||
| >9.4–11.1 | 31/981 | 3.2 (2.2–4.5) | 0.90 (0.55–1.48) | 0.683 | ||
| >11.1 | 114/2286 | 5.0 (4.1–6.0) | 1.44 (0.97–2.14) | 0.068 | ||
| No pre-existing diabetes | All-cause mortality | 3.9–6.1 | 270/4023 | 6.7 (5.9–7.6) | Referent | NA |
| >6.1–7.8 | 273/3089 | 8.8 (7.8–10.0) | 1.26 (1.05–1.50) | 0.013 | ||
| >7.8–9.4 | 150/1171 | 12.8 (10.8–15.0) | 1.47 (1.18–1.82) | <0.001 | ||
| >9.4–11.1 | 60/468 | 12.8 (9.8–16.5) | 1.41 (1.04–1.90) | 0.027 | ||
| >11.1 | 83/524 | 15.8 (12.6–19.6) | 1.50 (1.11–2.02) | 0.008 | ||
| Cardiovascular mortality | 3.9–6.1 | 182/4023 | 4.5 (3.9–5.2) | Referent | NA | |
| >6.1–7.8 | 190/3089 | 6.2 (5.3–7.1) | 1.28 (1.03–1.59) | 0.024 | ||
| >7.8–9.4 | 103/1171 | 8.8 (7.2–10.7) | 1.54 (1.18–1.99) | 0.001 | ||
| >9.4–11.1 | 44/468 | 9.4 (6.8–12.6) | 1.64 (1.16–2.33) | 0.006 | ||
| >11.1 | 58/524 | 11.1 (8.4–14.3) | 1.51 (1.05–2.18) | 0.025 |
pyrs, person-years.
In those without pre-existing diabetes, all-cause mortality risk was significantly higher when blood glucose exceeded 6.1 mmol/L (Table 2). The adjusted HRs ranged from 1.26 (95% CI 1.05–1.50) for blood glucose >6.1–7.8 mmol/L (P = 0.013) to 1.50 (95% CI: 1.11–2.02) for values exceeding 11.1 mmol/L (P = 0.008). Cardiovascular mortality risk was higher among patients without pre-existing diabetes whose presentation blood glucose exceeded 6.1 mmol/L (Table 2). Adjusted HRs for cardiovascular death ranged from 1.28 (95% CI 1.03–1.59) for blood glucose >6.1–7.8 mmol/L (P = 0.024) to 1.64 (95% CI 1.16–2.33) for values >9.4–11.1 mmol/L (P = 0.006). There was a significant 18.9% improvement in NRI (95%CI; 0.5, 38.8%) for prediction of 30-day mortality by addition of presentation blood glucose to the EHMRG risk score in patients without pre-existing diabetes.
The association between presentation blood glucose and mortality was no longer significant at 1 year in patients with pre-existing diabetes (Supplementary material online, Appendix, Table SA). However, in patients without pre-existing diabetes, the risk of cardiovascular death was elevated albeit attenuated.
Association between presentation blood glucose and cardiovascular hospitalizations
In the pooled cohort of those with and without pre-existing diabetes (median follow-up 388 [IQR: 56–1430] days), there was significantly increased risk of hospitalizations with higher presentation blood glucose (Table 3). Adjusted HRs for cardiovascular hospitalization were 1.12 (95% CI 1.02–1.17) for presentation blood glucose >9.4–11.1 and 1.09 (95% CI 1.04–1.21) for values >11.1 mmol/L. For HF readmission outcomes, adjusted HRs were 1.15 (95% CI 1.05–1.25) for presentation blood glucose >9.4–11.1 and 1.15 (95% CI 1.07–1.24) for values >11.1 mmol/L. Similar trends were observed when stratified by diabetes status (Supplementary material online, Appendix, Tables SB and SC).
Association between presentation blood glucose and hospitalization
| Outcome | Presentation blood glucose (mmol/L) | Events/patients | Rate per 100 pyrs (95% CI) | Adjusted HR (95% CI) | P-value |
|---|---|---|---|---|---|
| Cardiovascular hospitalization | 3.9–6.1 | 3506/5294 | 34.7 (33.6–35.9) | Referent | NA |
| >6.1–7.8 | 3010/4546 | 37.4 (36.1–38.8) | 1.03 (0.98–1.09) | 0.263 | |
| >7.8–9.4 | 1588/2425 | 36.8 (35.0–38.6) | 1.02 (0.95–1.08) | 0.627 | |
| >9.4–11.1 | 1001/1449 | 43.7 (41.1–46.5) | 1.12 (1.04–1.21) | 0.004 | |
| >11.1 | 1954/2810 | 43.8 (41.9–45.8) | 1.09 (1.02–1.17) | 0.009 | |
| Heart failure hospitalization | 3.9–6.1 | 2637/5294 | 20.7 (19.9–21.5) | Referent | NA |
| >6.1–7.8 | 2281/4546 | 22.6 (21.7–23.5) | 1.03 (0.97–1.09) | 0.406 | |
| >7.8–9.4 | 1205/2425 | 22.2 (21.0–23.5) | 1.01 (0.94–1.08) | 0.849 | |
| >9.4–11.1 | 792/1449 | 27.0 (25.1–28.9) | 1.15 (1.05–1.25) | 0.002 | |
| >11.1 | 1590/2810 | 28.1 (26.8–29.6) | 1.15 (1.07–1.24) | <0.001 |
pyrs, person-years.
Association between presentation blood glucose and diabetes hospitalizations
Among patients with pre-existing diabetes examined over median follow-up 722 (IQR: 177–1815) days, presentation blood glucose >11.1 mmol/L was associated with significantly increased risk of diabetes-related hospitalizations (Table 4). When presentation blood glucose exceeded 11.1 mmol/L, the adjusted HR for diabetes-related hospitalization was 1.39 (95% CI 1.20–1.61; P < 0.001).
Association between presentation blood glucose and diabetes-related outcomes
| Group | Outcome | Presentation blood glucose (mmol/L) | Events/patients | Rate per 100 pyrs (95% CI) | Adjusted HR (95% CI) | P-value |
|---|---|---|---|---|---|---|
| Pre-existing diabetes | Diabetes-related hospitalizations | 3.9–6.1 | 316/1271 | 9.0 (8.0–10.1) | Referent | NA |
| >6.1–7.8 | 301/1457 | 7.2 (6.4–8.1) | 0.86 (0.72–1.02) | 0.079 | ||
| >7.8–9.4 | 343/1254 | 9.3 (8.4–10.4) | 1.09 (0.93–1.29) | 0.289 | ||
| >9.4–11.1 | 260/981 | 9.7 (8.5–10.9) | 1.06 (0.89–1.27) | 0.508 | ||
| >11.1 | 772/2286 | 13.0 (12.1–13.9) | 1.39 (1.20–1.61) | <0.001 | ||
| No pre-existing diabetes | New diabetes diagnosis | 3.9–6.1 | 405/4023 | 3.1 (2.8–3.4) | Referent | NA |
| >6.1–7.8 | 420/3089 | 4.6 (4.2–5.1) | 1.61 (1.39–1.87) | <0.001 | ||
| >7.8–9.4 | 197/1171 | 6.4 (5.5–7.3) | 2.42 (2.01–2.92) | <0.001 | ||
| >9.4–11.1 | 99/468 | 8.8 (7.2–10.8) | 3.76 (2.97–4.78) | <0.001 | ||
| >11.1 | 99/524 | 7.7 (6.3–9.4) | 3.61 (2.78–4.68) | <0.001 |
pyrs, person-years.
Association between presentation blood glucose and de novo diabetes
Among patients without pre-existing diabetes (median follow-up 823 [IQR: 195–1931] days), there was a statistically significant and progressively increased risk of de novo diabetes with higher presentation blood glucose with adjusted HRs ranging from 1.61 (>6.1–7.8 mmol/L) to 3.61 (>11.1 mmol/L) as shown in Table 4 (all P < 0.001). In sex-specific analyses, the association with de novo diabetes in men and women remained significant with adjusted time-to-diagnosis curves shown in Figure 2 (Supplementary material online, Appendix, Table SD).
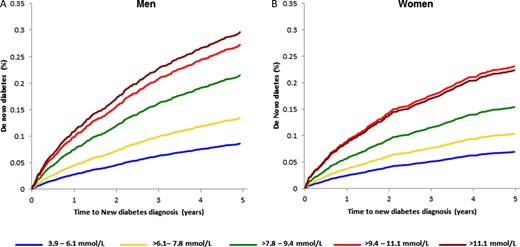
Adjusted sex-stratified time to de novo diabetes in (A) men and (B) women by presentation blood glucose category.
For each 1 mmol/L increase in blood glucose, the adjusted HR for de novo diabetes diagnosis was 1.14 (95% CI 1.12–1.16, P < 0.001), differing marginally by sex (P-interaction = 0.046). For each 1 mmol/L increase in presentation blood glucose, the HR for de novo diabetes was 1.18 (95% CI 1.14–1.23) in men and 1.13 (95%CI; 1.10–1.16) in women (both P < 0.001). There were no other significant clinical subgroup interactions for de novo diabetes (Figure 3).
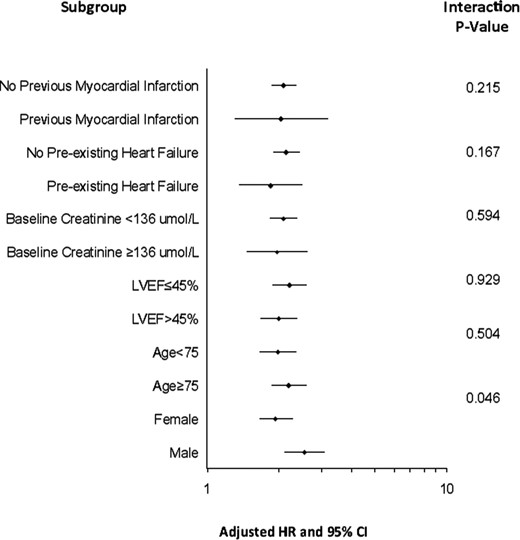
Subgroup analysis. Risk of de novo diabetes for each 1 mmol/L increase in presentation blood glucose stratified by baseline subgroups along with test for interaction.
For every 30 patients whose presentation blood glucose was >6.1–7.8 mmol/L, 14 patients >7.8–9.4 mmol/L, 9 patients >9.4–11.1 mmol/L, and 11 patients >11.1 mmol/L, one new case of diabetes was diagnosed within 5 years (Supplementary material online, Appendix, Table SE).
Sensitivity analyses
When patients who were discharged from the ED (n = 5791, 65.7%) were excluded from the analysis, the results remained comparable (Supplementary material online, Appendix, Tables SF and SG).
Discussion
In this large, population-based cohort of patients presenting to an ED with AHFS, we found that presentation blood glucose exceeding 11.1 mmol/L in patients with pre-existing diabetes was associated with increased risk of 30-day all-cause death and diabetes-related hospitalizations. In patients without pre-existing diabetes, the risks of 30-day all-cause and cardiovascular mortality were increased, beginning to rise within normoglycaemia (>6.1 mmol/L). By 1 year, mortality risk remained elevated, albeit attenuated among those without pre-existing diabetes. A presentation blood glucose exceeding 9.4 mmol/L was also associated with increased risks of HF and cardiovascular hospitalization. Furthermore, presentation blood glucose at the upper-end of normoglycaemia was associated with over 1.6-fold risk of de novo diabetes while higher values conferred up to 4-fold risk of a new diabetes diagnosis in both men and women.
Two recent studies examining the association between blood glucose and mortality among patients with AHFS demonstrated contrasting results. In a large cohort of elderly Medicare beneficiaries, there was no significant association between presentation blood glucose >6.1 and 30-day mortality.3 Those with co-morbid conditions, such as end-stage renal disease, valvular heart disease, cirrhosis, immunosuppression, and cancer, accounted for 16% of the analysable population but were excluded. In contrast, a large multinational European and North American cohort found a strong association between 30-day mortality and blood glucose elevation, defined as >7 mmol/L, in patients without diabetes and >10 mmol/L in diabetes patients.4 The differences between studies may in part, be explained by variations in demographics and co-morbidities between the three cohorts. Our population-based sample was older with more co-morbid coronary artery disease, renal impairment, and COPD than the latter study,4 but younger with fewer of the above comorbidities than the former.3
Diabetes is associated with increased mortality risk and significant morbidity, including hospitalizations for diabetes-related complications.23 Effective primary care offers the potential to prevent diabetes-related hospitalizations and early detection of high-risk patients may further reduce this risk.24 Our results indicate that blood glucose concentration at hospital presentation is prognostically important in patients with AHFS, as demonstrated by higher risk of early mortality and increased risk of diabetes-related hospitalizations in longer-term follow-up among diabetes patients. Hyperglycaemia at the time of AHFS presentation may be a surrogate for the severity of the acute inflammatory state or a marker of poor outpatient glycaemic control. Interestingly, unadjusted 30-day mortality rates were higher amongst those without pre-existing diabetes, suggesting that hyperglycaemia may have been better recognized and treated when diabetes was a known condition prior to admission.
Diabetes is an established risk factor for HF, but it has not previously been reported that HF predisposes to de novo diabetes.25 Chronic HF is characterized by loss of skeletal muscle, which is the major site of glucose utilization, promoting an insulin resistant state.26 Insulin resistance may be further exacerbated by the pro-inflammatory state associated with HF.27 Physiologic studies have shown that worse NYHA functional status in HF patients without diabetes is associated with higher fasting glucose and insulin levels compared with patients with less severe symptoms.28 Clinical studies also support the notion that HF and particularly worse functional status (NYHA class III–IV symptoms) is associated with increased risk of new-onset diabetes.29,30
We present a novel finding in AHFS, demonstrating an association between elevated blood glucose at presentation with subsequent incident diabetes. Our findings are consistent with other studies in different clinical populations such as critically ill patients,31 and men with AMI32 where a blood glucose exceeding 7.8 mmol/L was predictive of subsequent diabetes risk. Unlike the latter study conducted primarily in men,32 the relationship we observed was present in men and women with AHFS at an even lower blood glucose threshold of 6.1 mmol/L, irrespective of antecedent HF or myocardial infarction. Based on our cohort, a lower blood glucose threshold of 6.1 mmol/L, rather than 7.8 mmol/L, has substantial implications because this more stringent criterion for normalcy identifies an additional 30% of patients at risk of future diabetes for whom heightened surveillance may be warranted.
Our findings have several important implications for clinical practice. Thirty-day mortality is high in AHFS and interventions to reduce this risk are needed. Blood glucose at ED presentation identifies a large group of patients with diabetes and HF who are at risk of further deterioration because of poor glycaemic control or insulin resistance, and in non-diabetes patients, may allow for earlier recognition and monitoring for the development of incident disease. Examination of presentation blood glucose may allow for more timely primary and secondary intervention strategies to prevent future diabetes-related hospitalizations and complications. In patients with AMI, a blood glucose exceeding 7.8 mmol/L in non-diabetic patients was found to be predictive of future diabetes risk.32 The European Society of Cardiology now recommends that all patients presenting with AMI and any degree of hyperglycaemia be tested for diabetes prior to discharge.33 Our findings extend the relationship to AHFS and add further strength to the HF guideline recommendations of the need for measurement of blood glucose and its prognostic importance.34 Thus, blood glucose at presentation may serve as a screen to identify high-risk patients who warrant formal testing for diabetes allowing for prompt referral to prevent further morbidity and mortality.
Our study is not without limitations. We examined presentation blood glucose and did not use alternative metrics, such as mean in-hospital glucose, to evaluate hyperglycaemia. Others, however, have shown the incremental benefit of such metrics is marginal.32 Ascertainment of de novo diabetes was clinically dependent, and thus diagnostic testing was at the discretion of the caring physician, rather than protocol driven. However, clinically driven screening likely attenuated the observed association between presentation blood glucose and de novo diabetes. Haemoglobin A1C is not routinely performed in hospital, and it is conceivable that some diabetes patients may have been classified as non-diabetic if they had normal levels of blood glucose but elevated (and unmeasured) haemoglobin A1C. Additionally, discharge blood glucose was not collected in our study, which may have explained further outcome variations when added to presentation measures. However, the effects of both of the above limitations would be attenuation of our estimated hazard ratios, and availability of these measures would likely have resulted in greater magnitude of effect. Finally, due to small numbers with presentation blood glucose <3.9 or >33.3 mmol/L, a robust analysis of these patients could not be performed.
In conclusion, among AHFS patients without prior diabetes, modestly elevated blood glucose (>6.1 mmol/L) at ED presentation conferred higher risks of early all-cause and cardiovascular mortality and de novo diabetes diagnosis. Among diabetes patients presenting with AHFS, a blood glucose exceeding 11.1 mmol/L, was associated with higher risks of early mortality and long-term diabetes-related hospitalization. The acute measurement of blood glucose at HF presentation provides prognostic value and may be a potential target to improve outcomes in patients with AHFS.
Supplementary material
Supplementary material is available at European Heart Journal online.
Funding
Supported by operating grant MOP 114937 from the Canadian Institutes of Health Research (CIHR), Career Investigator Awards from the Heart and Stroke Foundation of Ontario (P.C.A., J.V.T.), New Investigator Award from the Canadian Institutes of Health Research (L.L.L.), a Canada Research Chair in Health Services Research (J.V.T.), and a CIHR Clinician-Scientist Award (D.S.L.). Funding to pay the Open Access publication charges for this article was provided by the Canadian Institutes of Health Research (CIHR).
Conflict of interest: none declared.
Acknowledgements
From the Institute for Clinical Evaluative Sciences (M.S., X.W., P.C.A., L.L.L., J.V.T., D.S.L.), Women's College Hospital (L.L.L.), Mt. Sinai Hospital (G.E.N.), Sunnybrook Health Sciences Centre (J.V.T.), Institute for Health Policy, Management, and Evaluation (P.C.A., J.V.T., D.S.L.), Schulich Heart Research Program, Sunnybrook Research Institute (P.C.A.), Peter Munk Cardiac Centre of the University Health Network—Toronto General Hospital (G.E.N., D.S.L.), University of Toronto, Toronto, Canada, and the National Heart, Lung, and Blood Institute's Framingham Heart Study, Framingham, MA (R.S.V.) and Boston University School of Medicine, Boston, MA (R.S.V.).
References

