


Abstract
To investigate the influence of cardiovascular risk factors (CV-RFs) on infarct severity and post-infarction left ventricular (LV) remodelling in acutely reperfused ST-segment elevation myocardial infarction (STEMI) patients studied with cardiovascular magnetic resonance (CMR).
Four-hundred seventy-one patients were included in the study. Baseline CMR was performed at 4 ± 1 days after STEMI to assess area-at-risk, infarct size (IS), myocardial salvage index (MSI), microvascular obstruction (MVO), intramyocardial haemorrhage (IMH), LV volumes, and function. Cardiovascular magnetic resonance was repeated 4 months after STEMI (n = 383) to assess adverse LV remodelling (increase of LV end-diastolic volume >20% between baseline and follow-up). Smoking was associated with IMH at baseline even after correction for other factors associated with ischaemia-reperfusion injury including MVO, IS, and MSI (OR: 2.17, 95% CI: 1.17–4.00, P = 0.01). Unexpectedly, smoking was an independent protective predictor against adverse LV remodelling (OR: 0.43, 95% CI: 0.24–0.77, P = 0.005), consistent with the ‘smoker's paradox’. However, the presence of IMH at baseline abolished the paradoxical, beneficial effects of smoking with respect to IS, baseline LV function, and post-infarction LV remodelling. No association between other CV-RFs, infarct severity, or post-infarction LV remodelling was observed.
In patients with reperfused STEMI, smoking is strongly and independently associated with IMH at baseline. Nonetheless, consistent with the ‘smoker's paradox’, smoking was an independent predictor of more favourable post-infarction LV remodelling. However, the paradoxical beneficial effects of smoking were lost in patients with IMH.
Introduction
Traditional cardiovascular risk factors (CV-RFs) including high cholesterol, arterial hypertension, family history of ischaemic heart disease, smoking, diabetes, and obesity predict coronary artery disease at the level of the epicardial vessels and microvasculature.1–3 For many years preceding an acute coronary syndrome, these CV-RFs exert detrimental effects at different levels of the coronary circulation via endothelial dysfunction, enhanced inflammation and oxidative stress, predisposing patients to acute ischaemic complications.3 However, the influence of CV-RFs on the severity of ischaemic myocardial damage at the time of acute ST-segment elevation myocardial infarction (STEMI) and, thereafter on post-infarction left ventricular (LV) remodelling, has not been explored yet.
With the advent of cardiovascular magnetic resonance (CMR) imaging, comprehensive information on myocardial infarction severity can be obtained in a single exam, including the extent of the area-at-risk (AAR), infarct size (IS), myocardial salvage index (MSI), microvascular obstruction (MVO), and intramyocardial haemorrhage (IMH), along with an accurate assessment of LV morphology and function.4–6 Intramyocardial haemorrhage is a marker of irreversible damage of the coronary microvasculature, and is a strong and independent predictor of adverse LV remodelling and clinical outcome in patients with STEMI.7–9 Our aim was to determine the influence of CV-RFs on the pattern of acute ischaemic damage and post-infarction LV remodelling in a large prospective cohort of patients with STEMI treated by primary percutaneous coronary intervention (pPCI), using comprehensive CMR at a baseline early post-infarction phase and after 4-month follow-up.
Methods
Study design
This is a multicentre, prospective, longitudinal study conducted in a cohort of acute STEMI patients studied with CMR. Between May 2005 and May 2014, 512 acute STEMI patients from three tertiary referral centres [244 at University Hospitals Leuven, Leuven, Belgium (Centre A), 157 at La Sapienza University Hospital, Rome, Italy (Centre B), and 111 at Fondazione G. Monasterio, Pisa, Italy (Centre C)] were screened for study enrolment. Patients were included if they were older than 18 years, met ECG criteria for acute STEMI and were successfully treated by pPCI within 12 h of symptom onset (i.e. chest pain). Exclusion criteria included pulmonary oedema and/or cardiogenic shock persisting after the first week of hospitalization, prior coronary revascularization or myocardial infarction, claustrophobia and glomerular filtration rate <30 mL/min. The study complied with the Declaration of Helsinki. Local ethic review boards approved the protocol, and written informed consent was obtained from all patients.
Coronary artery disease risk factor assessment
In each centre, a cardiologist blinded to CMR results, assessed CV-RFs profile using a structured interview. Patients who smoked regularly during the previous 12 months were classified as smokers.10 Diabetes was considered present if patients had history of diabetes and they were on insulin or oral hypoglycaemic agents.11 Hypertension was defined as history of high blood pressure in association with antihypertensive medical therapy,12 or evidence of high systolic (>140 mmHg, or >135 mmHg in diabetic patients) or diastolic (>90 mmHg, or >85 mmHg in diabetic patients) blood pressure during hospitalization. Patients were identified as having dyslipidaemia if this condition was certified by the treating physician, if patients were on lipid-lowering medications or if low-density lipoprotein cholesterol levels exceeded 160 mg/dL (4.14 mmol/L).13 Family history of coronary artery disease was defined as the presence of cardiovascular disease in a first-degree relative before the age of 55 years for men or 65 years for women. Obesity was defined as a BMI ≥ 30.14 At follow-up, patients were classified according to their risk profile at baseline. Clinical management, medical treatment, and pPCI were performed according to the most recent ESC guidelines for acute STEMI.15
Cardiovascular magnetic resonance protocol
All CMR studies were performed on 1.5T units, Intera-CV (Philips, Best, The Netherlands) (Centre A), Avanto (Siemens, Erlangen, Germany) (Centre B), and CVi (GE Healthcare, Milwaukee, WI, USA) (Centre C), using dedicated cardiac software, phased-array surface receiver coils, and electrocardiogram triggering. Breath-hold steady-state free-precession cine CMR was performed in cardiac vertical and horizontal long-axis and in short-axis orientation. Area-at-risk and IMH were determined using breath-hold black-blood T2-weighted short inversion-time inversion-recovery fast spin-echo sequence in cardiac short axis. Post-contrast breath-hold T1-weighted 2D (Avanto/CVi) or 3D (Intera) inversion-recovery segmented gradient-echo sequence was used to detect MVO and myocardial necrosis. Late gadolinium enhancement (LGE) imaging was performed 10–20 min following contrast administration.
Image analysis
All CMR studies were analysed by experienced observers blinded to the clinical data (JB, MF, PGM). T2-weighted images were used to quantify AAR and to determine the presence of IMH in the ischaemic myocardium. In the LV myocardial wall supplied by the infarct-related artery, myocardial tissue with signal intensity (SI) 2 SDs above the mean signal obtained in the remote non-infarcted myocardium was considered AAR. The contours of automatically detected AAR were manually adapted to exclude increased SI from the adjacent blood pool (‘slow flow’) or artefacts related to cardiac motion or respiration. Intramyocardial haemorrhage was defined as a ≥1 mL hypointense area in the core of the AAR having mean SI < 2SD the SI of the periphery of the AAR. Intramyocardial haemorrhage was considered part of myocardial oedema for calculating AAR.7 On LGE images, infarcted myocardium was identified as the myocardium with SI > 5SD exceeding the mean SI of remote myocardium. The contours of automatically detected infarcted myocardium were manually adapted. Microvascular obstruction was defined as the hypoenhanced region within the infarcted myocardium. If present, MVO was considered part of the infarcted myocardium (Figure 1). Myocardial salvage index was defined as the difference between AAR and IS divided by AAR extent.4 Cardiovascular magnetic resonance was used to calculate LV end-diastolic (EDV), end-systolic (ESV) and stroke (SV) volumes, ejection fraction (EF), and mass. Left ventricular volumes and mass were normalized to BSA, IS was normalized to LV mass (IS%).
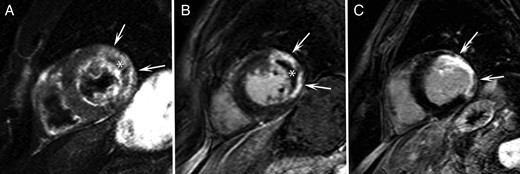
(A) Short-axis T2-weighted image at baseline shows high signal intensity in the left ventricular lateral wall corresponding to the area-at-risk (arrows). Central hypointense area corresponds with intramyocardial haemorrhage (asterisk). (B) Short-axis late gadolinium enhancement image at baseline shows high signal intensity in the left ventricular lateral wall corresponding to an extensive area of transmural necrosis (arrows). Central hypointense area corresponds with microvascular obstruction (asterisk). (C) Short-axis late gadolinium enhancement image at follow-up shows important wall thinning and remodelling of the lateral wall (arrows).
Statistical analysis
Continuous variables were expressed as mean ± SD or median (25th–75th percentiles) as appropriate. Categorical variables were expressed as frequency with percentage. Student's independent sample t- or the Mann–Whitney test was used as appropriate to compare continuous variable differences. A comparison between categorical variables was performed by χ2 test. Pearson's correlation coefficient (r) was used to test correlation between continuous variables. Student's paired sample t- or Wilcoxon's test was used as appropriate to compare continuous variable differences between baseline and follow-up. Adverse LV remodelling was defined as an increase in LV-end-diastolic volume index (EDVi) >20% between baseline and follow-up.16,17 Univariable logistic regression analysis was utilized to assess the association between baseline variables and CV-RFs with IMH occurrence at baseline CMR and adverse LV remodelling. Variables with P< 0.10 at univariable analysis were included as covariates in multivariable logistic regression analysis. Considering the association between active smoking and IMH occurrence, the interaction of these variables on adverse LV remodelling was tested. Considering the strong correlation between AAR and IS (r = 0.84, P < 0.001) and between left ventricular ejection fraction (LV-EF) and LV-ESVi (r = −0.76, P < 0.001), these covariates were introduced separately in the multivariable models. All statistical analyses were conducted with SPSS (version 17.0, SPSS, Chicago, Illinois). P-values of <0.05 were considered to indicate statistical significance. All reported P-values are two tailed.
Results
Study population
Baseline characteristics are summarized in Table 1. Of 512 eligible patients, 471 were included in the final analysis at baseline and 383 (81%) at follow-up (Figure 2). All patients were successfully treated with pPCI within 12 h of symptom onset (median: 196 min, 25th–75th percentiles: 140–295 min). Cardiovascular magnetic resonance was performed as soon as reasonably achievable, with respect to clinical status and organizational feasibility. Nearly half of the patients were smokers (48%), and they were approximately one decade younger than non-smokers and had less diabetes.
Baseline characteristics in non-smokers vs. smokers
| Variable | All | Non-smokers | Smokers | P-value |
|---|---|---|---|---|
| (n = 471) | (n = 244) | (n = 227) | ||
| Age (years) | 60.0 ± 11.6 | 64.4 ± 11.3 | 55.3 ± 9.9 | <0.001 |
| BMI (kg/m²) | 26.9 ± 3.9 | 27.0 ± 4.0 | 26.9 ± 3.9 | 0.75 |
| CV-RFs n (%) | ||||
| Male gender | 390 (83) | 195 (80) | 195 (86) | 0.09 |
| Diabetes | 70 (15) | 45 (18) | 25 (11) | 0.02 |
| Hypertension | 215 (46) | 119 (49) | 96 (42) | 0.16 |
| Dyslipidaemia | 282 (60) | 152 (62) | 130 (57) | 0.27 |
| Family history of CAD | 232 (49) | 119 (49) | 113 (50) | 0.83 |
| Obesity | 87 (19) | 43 (18) | 44 (19) | 0.65 |
| Medical treatment at baseline n (%) | ||||
| ACEi/ARB | 53 (11) | 34 (14) | 19 (8) | 0.06 |
| β-blocker | 48 (10) | 23 (9) | 25 (11) | 0.54 |
| Statin | 50 (11) | 33 (14) | 17 (8) | 0.24 |
| Antiplatelet agent | 37 (8) | 26 (11) | 11 (5) | 0.26 |
| Oral hypoglycaemic drug | 20 (4) | 14 (6) | 6 (3) | 0.10 |
| Insulin | 12 (3) | 9 (3) | 3 (1) | 0.14 |
| Blood pressure on admission (mmHg) | ||||
| Systolic | 131.8 ± 22.6 | 132.0 ± 22.0 | 131.6 ± 23.4 | 0.86 |
| Diastolic | 78.1 ± 12.9 | 77.8 ± 13.0 | 78.5 ± 12.7 | 0.57 |
| Peak troponin I (µg/L) | 50.0 (13.0–111.9) | 53.9 (10.5–117.3) | 44.1 (16.0–99.2) | 0.82 |
| Time to pPCI (min) | 196 (140–295) | 210 (150–300) | 189 (138–282) | 0.14 |
| Infarct-related vessel, n (%) | ||||
| RCA | 141 (30) | 73 (30) | 68 (30) | 0.84 |
| LAD | 236 (50) | 127 (52) | 109 (48) | 0.38 |
| LCx | 94 (20) | 44 (18) | 50 (22) | 0.28 |
| TIMI 0–1 flow grade before pPCI, n (%) | 286 (72) | 138 (68) | 148 (76) | 0.11 |
| TIMI 3 flow grade after pPCI, n (%) | 351 (88) | 181 (90) | 170 (87) | 0.38 |
| SYNTAX score | 16.9 ± 8.9 | 17.5 ± 9.3 | 16.1 ± 8.3 | 0.11 |
| RCA dominance, n (%) | 364 (92) | 182 (90) | 182 (93) | 0.28 |
ACEi, angiotensin-converting enzyme inhibitor; ARB, angiotensin-II inhibitor; CV-RFs, cardiovascular risk factors; LAD, left anterior descending coronary artery; LCx, left circumflex coronary artery; pPCI, primary percutaneous coronary intervention; RCA, right coronary artery; TIMI, thrombolysis in myocardial infarction; Time to pPCI, time from symptom onset to pPCI; SYNTAX, synergy between PCI with TAXUS and cardiac surgery; TIMI-grade, SYNTAX score and coronary dominance in 398 patients (non-current smoking = 202; current smoking = 196).
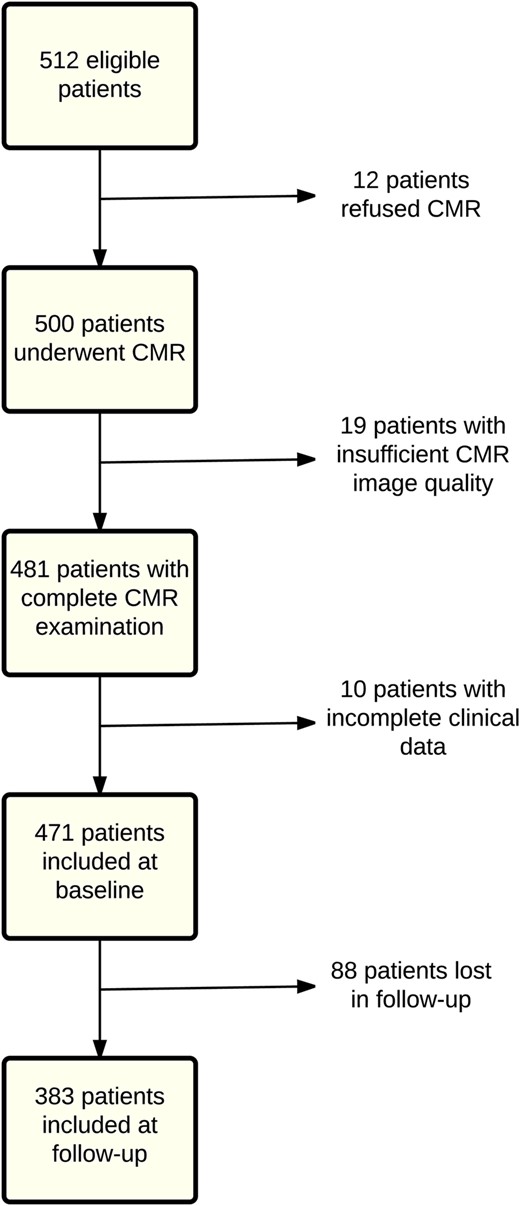
Patient flow chart.
Cardiovascular risk factors and infarct severity
Intramyocardial haemorrhage was detected in 118 patients (25%). Smokers had larger LV-EDVi, SVi, and higher incidence of IMH compared with non-smokers (31 vs. 20%, P = 0.005). At follow-up, LV-EF increased in smokers and non-smokers due to a slight but significant increase in LV-EDVi (Table 2). With the exception of smoking, no association was observed between CV-RFs and LV-EF, IS, MVO, IMH, or LV volumes. Indeed, smoking was strongly and independently associated with occurrence of IMH (see Supplementary material online).
Cardiovascular magnetic resonance data at baseline and follow-up
| Variable | All | Non-smokers | Smokers | P-value |
|---|---|---|---|---|
| Baseline | (n = 471) | (n = 244) | (n = 227) | |
| Follow-up | (n = 383) | (n = 194) | (n = 189) | |
| AAR (g) | ||||
| Baseline | 34.3 ± 21.7 | 34.9 ± 21.2 | 33.7 ± 22.3 | 0.55 |
| IS% | ||||
| Baseline | 16.7 ± 12.8 | 17.4 ± 13.2 | 15.9 ± 12.4 | 0.22 |
| Follow-up | 11.0 ± 8.9 | 11.6 ± 9.3 | 10.4 ± 8.6 | 0.20 |
| P-value | <0.001 | <0.001 | <0.001 | |
| MSI (%) | ||||
| Baseline | 42.4 ± 26.7 | 42.4 ± 26.9 | 42.3 ± 26.6 | 0.96 |
| MVO, n (%) | ||||
| Baseline | 212 (45) | 104 (43) | 108 (48) | 0.28 |
| IMH, n (%) | ||||
| Baseline | 118 (25) | 48 (20) | 70 (31) | 0.005 |
| LV-EDVi (mL/m²) | ||||
| Baseline | 78.3 ± 18.5 | 76.2 ± 18.0 | 80.6 ± 18.8 | 0.01 |
| Follow-up | 82.5 ± 21.4 | 81.8 ± 20.5 | 83.2 ± 22.4 | 0.53 |
| P-value | <0.001 | <0.001 | 0.04 | |
| LV-ESVi (mL/m²) | ||||
| Baseline | 40.1 ± 14.5 | 39.4 ± 14.3 | 40.8 ± 14.7 | 0.30 |
| Follow-up | 40.7 ± 16.8 | 40.7 ± 16.5 | 40.7 ± 17.1 | 0.98 |
| P-value | 0.54 | 0.07 | 0.45 | |
| LV-SVi (mL/m²) | ||||
| Baseline | 38.2 ± 9.4 | 36.7 ± 8.8 | 39.7 ± 9.8 | <0.001 |
| Follow-up | 41.8 ± 10.6 | 41.1 ± 10.3 | 42.4 ± 10.9 | 0.23 |
| P-value | <0.001 | <0.001 | <0.001 | |
| LV-EF (%) | ||||
| Baseline | 49.5 ± 9.9 | 49.0 ± 9.8 | 50.1 ± 9.9 | 0.20 |
| Follow-up | 51.8 ± 10.3 | 51.4 ± 10.4 | 52.2 ± 10.2 | 0.47 |
| P-value | <0.001 | <0.001 | <0.001 | |
| LV-Mass (g/m²) | ||||
| Baseline | 64.4 ± 15.4 | 63.4 ± 15.4 | 65.4 ± 15.2 | 0.16 |
| Follow-up | 56.7 ± 12.2 | 56.5 ± 12.2 | 56.9 ± 12.2 | 0.76 |
| P-value | <0.001 | <0.001 | <0.001 | |
AAR, area-at-risk; EDVi, end-diastolic volume index; EF, ejection fraction; ESVi, end-systolic volume index; IMH, intramyocardial haemorrhage; IS, infarct size; LV, left ventricular; MSI, myocardial salvage index; MVO, microvascular obstruction; SVi, stroke-volume index.
Stratification of patients based on the presence or absence of IMH is shown in Table 3 and Figure 3. In the non-IMH group, smokers had smaller IS, despite similar AAR, greater LV-EF and LV-SVi than non-smokers. At follow-up, LV-EF and LV-SVi improved in smokers and non-smokers. However, in smokers this improvement was attributed to a decrease of LV-ESVi. Conversely, in non-smokers the improvements of LV-EF and LV-SVi were related to an increase of LV-EDVi rather than to a reduction of LV-ESVi. These findings denote that in the non-IMH group, smokers experienced more favourable post-infarction LV remodelling than non-smokers.
Cardiovascular magnetic resonance data at baseline and follow-up in the subgroups with and without intramyocardial haemorrhage
| No IMH | Smokers | Non-smokers | P-value |
|---|---|---|---|
| Baseline/follow-up | (n = 157/134) | (n = 196/156) | |
| Age (years) | 57 ± 10 | 64 ± 11 | <0.001 |
| Diabetes, n (%) | 14 (9) | 34 (17) | 0.02 |
| AAR (g) | 28.2 ± 18.8 | 31.0 ± 19.1 | 0.46 |
| MVO, n (%) | 43 (27) | 65 (33) | 0.44 |
| IS% baseline | 11.5 ± 8.9 | 14.7 ± 11.3 | 0.003 |
| IS% follow-up | 7.5 ± 5.9 | 10.4 ± 8.6 | 0.001 |
| P-value | <0.001 | <0.001 | |
| LV-EDVi (mL/m2) baseline | 77.6 ± 16.4 | 74.0 ± 16.3 | 0.15 |
| LV-EDVi (mL/m2) follow-up | 78.0 ± 17.0 | 78.6 ± 18.4 | 0.78 |
| P-value | 0.75 | <0.001 | |
| LV-ESVi (mL/m2) baseline | 37.7 ± 12.5 | 37.4 ± 12.7 | 0.70 |
| LV-ESVi (mL/m2) follow-up | 35.9 ± 13.1 | 37.2 ± 13.3 | 0.41 |
| P-value | 0.04 | 0.72 | |
| LV-SVi (mL/m2) baseline | 40.0 ± 8.8 | 36.6 ± 8.4 | 0.001 |
| LV-SVi (mL/m2) follow-up | 42.0 ± 9.5 | 41.3 ± 10.5 | 0.61 |
| P-value | 0.01 | <0.001 | |
| LV-EF (mL/m2) baseline | 51.9 ± 9.0 | 50.1 ± 9.2 | 0.03 |
| LV-EF (mL/m2) follow-up | 54.9 ± 9.4 | 53.5 ± 9.5 | 0.21 |
| P-value | <0.001 | <0.001 | |
| LV-Mass (mL/m2) baseline | 62.6 ± 13.5 | 60.4 ± 11.9 | 0.52 |
| LV-Mass (mL/m2) follow-up | 55.7 ± 11.4 | 55.9 ± 12.5 | 0.87 |
| P-value | <0.001 | <0.001 | |
| IMH | Smokers | Non-smokers | P-value |
| Baseline/follow-up | (n = 70/55) | (n = 48/38) | |
| Age (years) | 55 ± 8 | 64 ± 11 | <0.001 |
| Diabetes, n (%) | 11 (16) | 11 (23) | 0.32 |
| AAR (g) | 48.1 ± 23.0 | 50.5 ± 22.5 | 0.58 |
| MVO, n (%) | 65 (93) | 39 (81) | 0.06 |
| IS% baseline | 25.8 ± 13.2 | 28.1 ± 14.6 | 0.37 |
| IS% follow-up | 18.0 ± 9.8 | 17.1 ± 10.3 | 0.74 |
| P-value | <0.001 | <0.001 | |
| LV-EDVi (mL/m2) baseline | 88.9 ± 18.6 | 84.2 ± 18.4 | 0.21 |
| LV-EDVi (mL/m2) follow-up | 95.8 ± 28.4 | 95.2 ± 23.5 | 0.92 |
| P-value | 0.01 | <0.001 | |
| LV-ESVi (mL/m2) baseline | 49.7 ± 15.2 | 47.3 ± 13.7 | 0.55 |
| LV-ESVi (mL/m2) follow-up | 52.2 ± 20.0 | 55.1 ± 20.5 | 0.50 |
| P-value | 0.29 | 0.001 | |
| LV-SVi (mL/m2) baseline | 39.1 ± 8.4 | 36.3 ± 9.7 | 0.13 |
| LV-SVi (mL/m2) follow-up | 43.5 ± 13.8 | 40.0 ± 9.4 | 0.15 |
| P-value | 0.002 | 0.03 | |
| LV-EF (mL/m2) baseline | 44.9 ± 9.2 | 43.4 ± 8.7 | 0.37 |
| LVEF (mL/m2) follow-up | 45.6 ± 9.2 | 42.9 ± 9.8 | 0.18 |
| P-value | 0.13 | 0.30 | |
| LV-Mass (mL/m2) baseline | 70.1 ± 15.4 | 68.1 ± 15.5 | 0.49 |
| LV-Mass (mL/m2) follow-up | 55.9 ± 13.7 | 59.1 ± 10.9 | 0.76 |
| P-value | <0.001 | <0.001 |
Abbreviations as reported in previous tables.
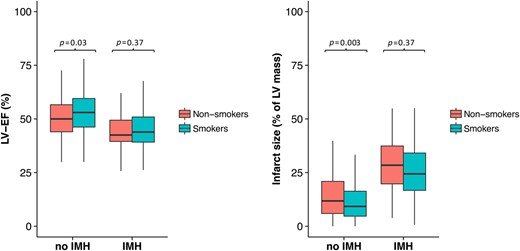
Differences in left ventricular ejection fraction (%) and IS% in the intramyocardial haemorrhage and non-intramyocardial haemorrhage group between smokers and non-smokers.
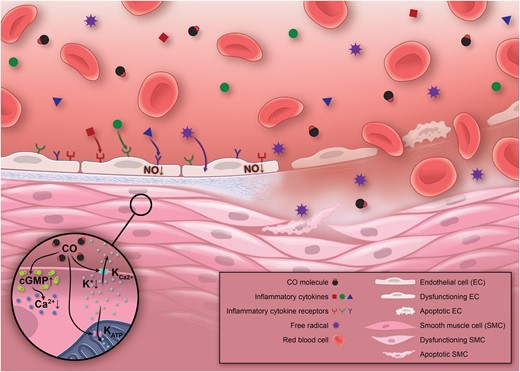
Smoking increases the oxidative stress to the endothelium by the formation of free radicals and inflammatory cytokines, which leads to a decrease of nitric oxide bioavailability and, thereby, to endothelial dysfunction. This may potentially render the endothelium more susceptible to ischaemia-reperfusion injury favouring the development of intramyocardial haemorrhage. Potential cardioprotective mechanisms mediated by inhaled carbon monoxide in smokers involve an increase in cyclic guanosine monophosphate levels and enhanced activity of big-conductance Ca2+-activated potassium channels (K+Ca2+), ultimately reducing intracellular Ca2+ concentrations and promoting vasodilatation. Additionally, carbon monoxide enhances the activity of mitochondrial ATP-dependent potassium channels (KATP) which prevents mitochondrial Ca2+ overload, a critical trigger for ischaemia-reperfusion injury. For a more detailed description of the potential cardioprotective mechanisms of carbon monoxide see Ref. 23. CO, carbon monoxide; cGMP, cyclic guanosine monophosphate.
In the IMH group, no significant differences were found between non-smokers and smokers with respect to IS, LV volumes, and LV-EF at baseline. At follow-up, LV-EF did not improve in smokers and non-smokers despite a significant increase of LV volumes, denoting adverse post-infarction LV remodelling in all patients, regardless of their smoking status.
The impact of smoking on post-infarction left ventricular remodelling
At univariable logistic regression, non-smoking, higher peak troponin level, larger AAR and infarct size, lower MSI, and MVO were associated with adverse LV remodelling (Table 4). No interaction was observed between smoking and IMH on adverse LV remodelling (P = 0.46). At multivariable logistic regression analysis, smoking remained a protective factor against adverse LV remodelling. This result was confirmed when AAR replaced infarct size in the multivariable model (Table 5).
Univariable analysis for determinants of adverse left ventricular remodelling
| Characteristics | OR (95% CI) | P-value |
|---|---|---|
| Age (per year) | 1.01 (0.99–1.03) | 0.44 |
| BMI (per kg/m²) | 0.55 (0.15–2.02) | 0.37 |
| Male gender (yes vs. no) | 0.59 (0.32–1.09) | 0.09 |
| Smoking (yes vs. no) | 0.44 (0.26–0.73) | 0.002 |
| Diabetes (yes vs. no) | 0.56 (0.24–1.28) | 0.17 |
| Hypertension (yes vs. no) | 0.90 (0.54–1.49) | 0.68 |
| Dyslipidaemia (yes vs. no) | 0.85 (0.52–1.41) | 0.53 |
| Familial history of CAD (yes vs. no) | 1.15 (0.70–1.88) | 0.59 |
| Obesity (yes vs. no) | 0.96 (0.51–1.80) | 0.90 |
| Peak Troponin (per µg/L) | 1.00 (1.00–1.01) | 0.01 |
| Time to pPCI (per min) | 1.00 (1.00–1.00) | 0.95 |
| AAR (per g) | 1.02 (1.00–1.03) | 0.007 |
| IS (per %) | 50.75 (7.89–326.42) | <0.001 |
| MSI (per %) | 0.23 (0.08–0.64) | 0.005 |
| MVO (yes vs. no) | 1.70 (1.03–2.80) | 0.04 |
| IMH (yes vs. no) | 1.64 (0.95–2.84) | 0.08 |
| β-Blocker (yes vs. no) | 1.59 (0.76–3.32) | 0.22 |
| ACEi/ARB (yes vs. no) | 1.27 (0.62–2.61) | 0.51 |
| Statin (yes vs. no) | 1.03 (0.45–2.39) | 0.94 |
| SYNTAX score (per point) | 1.03 (0.87–1.16) | 0.24 |
| RCA dominance (yes vs. no) | 0.78 (0.34–1.83) | 0.57 |
Abbreviations as reported in previous tables.
Multivariable analysis for determinants of adverse left ventricular remodelling
| Model-a | P-value | Model-b | P-value | |
|---|---|---|---|---|
| OR (95% CI) | OR (95% CI) | |||
| Male gender (yes vs. no) | 0.49 (0.24–1.01) | 0.05 | 0.43 (0.21–0.88) | 0.02 |
| Smoking (yes vs. no) | 0.43 (0.24–0.77) | 0.005 | 0.42 (0.23–0.75) | 0.003 |
| Peak troponin (per µg/L) | 1.00 (1.00–1.00) | 0.36 | 1.00 (1.00–1.00) | 0.36 |
| AAR (per g) | N/A | N/A | 1.01 (1.00–1.03) | 0.15 |
| IS (per %) | 11.87 (0.58–241.40) | 0.11 | N/A | N/A |
| MSI (per %) | 0.56 (0.14–2.26) | 0.41 | 0.30 (0.09–1.03) | 0.06 |
| MVO (yes vs. no) | 1.11 (0.54–2.26) | 0.87 | 1.14 (0.56–2.30) | 0.72 |
| IMH (yes vs. no) | 1.07 (0.50–2.29) | 0.87 | 1.08 (0.51–2.32) | 0.84 |
Abbreviations as reported in previous tables.
Smoking was protective against adverse LV remodelling at univariable and multivariable analysis in patients without IMH. On the contrary, in patients with IMH no association was observed between smoking and adverse LV remodelling (Table 6).
Univariable and multivariable analyses for adverse left ventricular remodelling based on the presence or absence of intramyocardial haemorrhage at baseline
| Variable | Overall | Smokers | Non-smokers | OR (95% CI) | P-value |
|---|---|---|---|---|---|
| No-IMH (n = 290) | |||||
| Adverse remodelling | 53/290 (18%) | 14/134 (10%) | 39/156 (25%) | 0.35 (0.18–0.67) | 0.002 |
| 0.38 (0.19–0.76)a | 0.006 | ||||
| IMH (n = 93) | |||||
| Adverse remodelling | 25/93 (27%) | 12/55 (22%) | 13/38 (34%) | 0.54 (0.21–1.36) | 0.19 |
aAfter correction for male gender, peak of troponin, IS, and MSI; abbreviations as in previous tables.
Discussion
In this multicentre, prospective study conducted in a cohort of acutely reperfused STEMI patients investigated with serial CMR, we found that smokers had a higher incidence of IMH than non-smokers, even though the former was ∼1 decade younger and had less co-morbidities than non-smokers. The association between smoking and IMH was confirmed by multivariable analysis after correction for factors implicated in ischaemia-reperfusion injury, including IS, MVO, and MSI. Despite the independent association between smoking and the development of IMH, smoking was an independent predictor of better post-infarction LV remodelling at follow-up. Furthermore, by dichotomizing the study population based on the presence or absence of IMH, we observed that in the subgroup without IMH smokers had lower IS, better LV systolic performance, and more favourable post-infarction LV remodelling compared with non-smokers. These paradoxical beneficial effects of smoking were abolished in patients with IMH.
In agreement with literature, we found that smokers were about one decade younger and had a more favourable CV-RFs profile than non-smokers. The better CV-RFs profile of smokers may explain the result of univariable analysis, which showed a protective effect of smoking against adverse LV remodelling. However, after adjustment for other factors implicated in post-infarction LV remodelling, such as IS and MSI, smoking remained an independent, paradoxical protective factor. These findings are consistent with the ‘smoker's paradox’, a previously reported, but not consistently observed, association between smoking and better short-term outcomes after acute infarction.18 The ‘smoker's paradox’ has been first described >25 years ago, and continues to stir discussions in studies of patients with acute myocardial infarction.19,20
Our study is the first to demonstrate an independent and strong association between smoking and IMH occurrence in a large prospective cohort of STEMI patients. Intramyocardial haemorrhage is a marker of severe ischaemia-reperfusion injury caused by profound structural damage of the coronary microvasculature, which leads to extravasation of erythrocytes.21 The hazardous effects of smoking on the microcirculation due to increased oxidative stress and prothrombotic state are well established.3 Given the central role of the coronary microcirculation in the development of post-infarction IMH and the detrimental effects of smoking on the microvasculature, it is conceivable that the coronary microcirculation in smokers was less resistant to ischaemia-reperfusion injury, explaining the strong and independent association between smoking and IMH (Figure 4).
Interestingly, our results suggest a different impact of smoking on acute ischaemic damage and post-infarction remodelling based on the presence or absence of IMH. In the subgroup of patients without IMH at baseline CMR, smokers had lower IS and better LV systolic performance compared with non-smokers. During follow-up, smokers showed an improvement in LV function due to a reduction in LV-ESVi without any concomitant variation in LV-EDVI, denoting a favourable pattern of ventricular remodelling. Conversely, in non-smokers, the improvement of LV-EF occurred at the expense of an increase of LV-EDVi without any reduction of LV-ESVi.
On the other hand, in patients with IMH, smokers and non-smokers showed comparable IS, LV volumes, and function. During follow-up, smokers and non-smokers showed an increase in LV volumes without improving LV-EF. These results were confirmed by univariable and multivariable analyses, which showed that in the non-IMH subgroup smoking was an independent protective predictor against adverse LV remodelling, whereas no association was found between smoking and post-infarction LV remodelling in the IMH subgroup. Thus, the development of profound structural damage of the coronary microvasculature at early post-infarction phase abolished the potential paradoxical protective effects of smoking with respect to IS and post-infarction LV remodelling. These findings, if confirmed by larger prospective studies, warrant a more vigorous strategy for mitigating the hazardous effects of ischaemia-reperfusion in smokers with STEMI. Remarkably, in the IMH subgroup the severity of acute ischaemic damage, LV dysfunction and post-infarction remodelling was comparable between smokers and non-smokers, although smokers were about one decade younger and had a more favourable CV-RFs profile than non-smokers.
Although the mechanisms explaining the loss of paradoxical beneficial effects of smoking in the IMH subgroup may be attributed to deleterious consequences of an impaired myocardial reperfusion,22 those associated with reduced IS and more favourable post-infarction LV remodelling in smokers compared with non-smokers in the non-IMH subgroup remain largely speculative. Carbon monoxide (CO) might be advocated as a potential beneficial mediator in smokers without IMH23 (Figure 4). Smokers have higher blood concentration of CO-haemoglobin than non-smokers, and CO is an important biological regulator with antioxidant, anti-inflammatory, anti-apoptotic, anti-thrombotic, and vasoregulatory properties. However, the lack of information on blood concentration of CO-haemoglobin and smoking habit during follow-up render further interpretation of our findings elusive, and further studies are warranted to better understand the potential mechanisms of the ‘smoker's paradox’.
Study limitations
This study was conducted at three different tertiary care centres using different vendor CMR units. A similar study protocol was used in all centres to maximise homogeneity in data acquisition (see Supplementary material online). Our study explored the association between CV-RFs, acute ischaemic myocardial damage, and post-infarction remodelling, which has not been reported in the literature. Accordingly, no preliminary statistical power analysis was performed. Second, we lacked pathological correlations of the presence and extent of IMH. Recent studies, however, have validated the accuracy of CMR in the diagnosis of IMH.21 Third, we used T2-weighted sequences to detect IMH. Recent studies showed T2*-weighted sequences to be more sensitive in detecting IMH.24 Thus, our study may slightly underestimate the prevalence of IMH. Fourth, patients with pulmonary oedema and/or cardiogenic shock persisting after the first week from the acute event were excluded from the study. Thus, our data cannot be generalized to STEMI patients with persistent haemodynamic instability. Fifth, we did not assess modifications in CV-RFs at follow-up. Therefore, we cannot determine a potential effect of smoking cessation on LV remodelling after 4 months. Finally, since the study participants were predominantly Caucasian, our results cannot be generalized to other ethnic groups.
Conclusion
In STEMI patients, smoking is associated with IMH independently of other factors implicated in ischaemia-reperfusion injury. Nonetheless, smoking was an independent protective predictor against adverse LV remodelling during short-term follow-up, consistent with the ‘smoker's paradox’. While this phenomenon was clearly observable in patients without IMH, ‘the smoker's paradox’ was abolished in patients developing IMH.
Supplementary material
Supplementary material is available at European Heart Journal online.
Authors’ contributions
R.S., P.G.M., P.C. performed statistical analysis; P.G.M., M.F., S.J., J.B. handled funding and supervision; R.S., P.G.M., M.F., A.B., I.C., L.A., N.G., J.B. acquired the data; R.S., P.G.M., M.F., J.B. conceived and designed the research; R.S., P.G.M., S.J., J.B. drafted the manuscript; R.S., P.G.M., M.F., P.C., A.B., I.C., L.A., N.G., S.J., J.B. made critical revision of the manuscript for key intellectual content.
Conflict of interest: none declared.
References
Author notes
Both first authors have equally contributed to this manuscript.

