


Abstract
The SCORE risk estimation system is used for cardiovascular risk stratification in apparently healthy adults and is based on known cardiovascular risk factors. The purpose of the current study was to evaluate whether exercise capacity can improve the accuracy of the SCORE overall survival risk estimation.
We investigated 22 878 asymptomatic men and women who were annually screened in a tertiary medical centre. All subjects were free of known ischaemic heart disease, and had completed maximal exercise stress test according to the Bruce protocol. The SCORE risk estimation system was used to evaluate individual cardiovascular risk for all subjects. The primary endpoint was mortality, after exclusion of patients with metastatic cancer during follow-up. The incremental contribution of exercise capacity in predicting the risk of death was evaluated by net reclassification improvement (NRI) and area under the receiver operating curve (AUROC). Mean age of the study population was 47.4 ± 10.3, and 71.6% were men. There were 505 (2.21%) deaths during a mean follow-up of 9.2 ± 4.1 years. Kaplan–Meier survival analysis showed that both SCORE and low exercise capacity were associated with reduced survival. When added to the SCORE risk prediction, exercise capacity allowed more accurate risk stratification: NRI analysis showed an overall improvement of 56.8% in the accuracy of classification and the AUROC increased (0.782 vs. 0.766).
Both SCORE and exercise capacity are strong independent predictors of all-cause mortality. The addition of exercise capacity to the SCORE risk model can improve the accuracy of the model.
Introduction
In apparently healthy adults, the Systematic Coronary Risk Evaluation Project (SCORE) estimation model can assist in cardiovascular mortality risk stratification and is based on traditional risk factors.1 While the SCORE system is based on robust data and was validated in multiple studies, it can still underestimate cardiovascular risk in apparently low-risk individuals. Examples for such individuals include sedentary subjects with central obesity, asymptomatic subjects with preclinical evidence of atherosclerosis, subjects with chronic kidney disease, etc.2 For these individuals, there is a need to improve the accuracy of the SCORE risk estimation model by incorporating additional predictors of cardiovascular risk.
While physical activity is recommended for primary prevention of cardiovascular disease (CVD), the objective evaluation of cardio-respiratory fitness is not currently used for risk stratification of low-risk individuals.2,3 Physical activity and cardio-respiratory fitness can prevent or delay the development of CVD risk factors such as diabetes mellitus and hypertension.4,5 In addition, regular physical activity can induce ischaemic pre-conditioning of the myocardium, which can lower the risk of fatal CVD events.2 Moreover, there are data to suggest that an objective evaluation of cardio-respiratory fitness can predict the risk of all-cause mortality and cardiovascular events in healthy men and women.6
Therefore, the aims of the current study were to (i) evaluate the association between exercise capacity and all-cause mortality in a large cohort of relatively low-risk asymptomatic men and women without known ischaemic heart disease, and (ii) investigate whether objective evaluation of exercise capacity can be used to improve the accuracy of the SCORE overall survival risk estimation.
Methods
Study population
Study population was described previously.7 The Institute for Medical Screening of the Chaim Sheba Medical Centre performs ∼9000 annual examinations of asymptomatic apparently healthy adults. A computerized database established in the year 2000 was used as the source of data for the present study. All subjects are self-referred asymptomatic patients attending periodic health screening examinations as private individuals or as part of health executive programmes. All subjects undergo annual evaluation that includes a questionnaire regarding their demographic characteristics, medical history, lifestyle, and health-related habits, as well as any unusual medical events since the previous encounter. The height and weight of all subjects are measured at each visit, together with a physical examination, blood pressure measurement, and laboratory blood tests that are processed at the centre's lab. The Framingham equation for total 10-year cardiovascular risk was calculated for all subjects. In addition, all subjects undergo baseline ECG followed by a standard exercise stress test (EST) according to the Bruce protocol. The Institutional Review Board of the Sheba Medical Centre approved this study on the basis of strict maintenance of participants' anonymity during database analyses. No individual consent was obtained.
Inclusion and exclusion criteria
The database includes 24 669 subjects who were examined in the centre between January 2000 and December 2014 and have a valid national identification number. Inclusion criteria for the current study included at least one visit to the centre. We excluded patients for which the SCORE cannot be calculated because of missing blood pressure or cholesterol data (n = 113), and patients for which EST data were not available (n = 587). We excluded patients with documented or suspected ischaemic heart disease (n = 1043). Lastly, we excluded subjects who were diagnosed with metastatic cancer during follow-up (n = 48), because mortality in these patients is likely to result from non-cardiovascular causes. The final study population comprised 22 878 subjects.
Exercise stress testing
A maximal EST according to the Bruce protocol was performed under the supervision of, and interpreted by, a board certified cardiologist at the first annual visit.8 Participants were encouraged to reach their maximal age-specific target heart rate, but the test may terminate early due to exhaustion or due to angina or other medical reasons. Using a standardized cuff sphygmomanometer, blood pressure was recorded at rest, at each stage change, at peak exercise, and during recovery.
Exercise capacity was evaluated according to treadmill exercise test duration. Treadmill test time was used to estimate aerobic consumption, expressed in metabolic equivalents (METs) based on well-characterized regression equations recommended by the American College of Sports Medicine.9–12 In addition, previous studies demonstrated that treadmill test time correlates well (r = 0.92) with maximal oxygen uptake.13
Study design and endpoints
The primary outcome of the current study was all-cause mortality. Survival data was available for all subjects from the Israeli Population Register up to January 2015. Metastatic cancer data were available from the Israeli Ministry of Health, and we excluded all patients diagnosed with metastatic cancer during follow-up. Exercise capacity was dichotomized to high vs. low based on estimated aerobic consumption (cut-off point of METs = 11).6 The SCORE risk estimation system was used to evaluate individual cardiovascular risk for all subjects, and was obtained using the official online risk calculator (https://escol.escardio.org/Heartscore/default.aspx?model=EuropeLow). Study population was divided into three groups based on the SCORE risk determined from the clinical data collected at the first visit to the centre, using the categories adopted by the European Society of Cardiology2: low risk (<1%; n = 11 727), moderate risk (1–4%; n = 9 777), and high risk (≥5%; n = 1374).
Statistical analyses
Continuous parameters of the study groups were compared using the Mann–Whitney U test. For comparison of categorical data, we used the Fisher's exact test. The probability of death according to SCORE and fitness groups was graphically displayed according to the method of Kaplan–Meier, with comparison of cumulative survival across strata by the log-rank test. The Kaplan–Meier curves for fitness groups (Figure 1) were adjusted to age and gender differences between groups by weighting observations so that any age and gender combination has the same relative importance that in the whole cohort. Cox proportional hazards regression modelling was used to determine the hazard ratio (HR) for all-cause mortality of different SCORE and fitness groups, compared with the lowest risk as a reference. We tested a multivariable model that included the SCORE risk and the following covariates: impaired fasting glucose (fasting glucose ≥100 mg/dL), reduced renal function (estimated GFR <60), overweight (BMI >25 kg/m2), and fitness either as a dichotomous variable (METs <11) or as a continuous variable. Kaplan–Meier event rates were evaluated at the median time for the study (9 years).
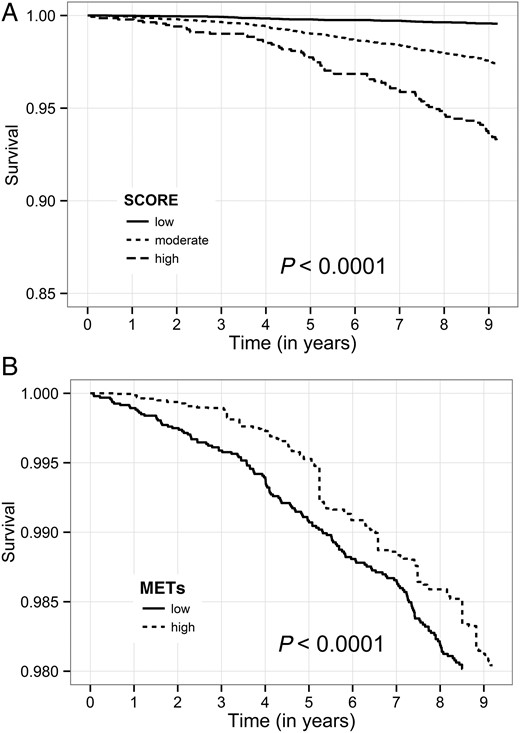
Kaplan–Meier Survival by SCORE risk (A) and estimated metabolic equivalents (B). SCORE is based on gender, age, systolic blood pressure, smoking status, total cholesterol, and high-density lipoprotein concentrations. Metabolic equivalents: low—metabolic equivalents <11; high— metabolic equivalents ≥11. Observations in each metabolic equivalents subgroup are matched for age and gender.
An association was considered statistically significant for a two-sided P-value of <0.05. The incremental contribution of exercise capacity in predicting the risk of death was evaluated using the net reclassification improvement (NRI) approach, we performed both continuous (category-less) analysis and categorical analysis using the survival data of the entire study population.14,15
All analyses were performed with R software version 3.1.1 (R Foundation for Statistical Computing). We used the R packages survIDINRI16 for bootstrapped NRI evaluation, and survC117 for Area Under Curve (AUC) inference on survival data.
Results
Subjects' characteristics
The final study population comprised 22 878 individuals, of whom 71.6% were men. Mean age was 47.4 ± 10.3 years, and the overall cohort was relatively healthy: there were 3607 (15.8%) hypertensive subjects, 14 651 (64%) reported that they exercise regularly, and 1001 (4.4%) subjects received chronic lipid-lowering drug therapy. Mean SCORE risk of the entire study population was 0.958 ± 1.44% [median 0, 10–90 percentile range (0–3)]. Study population included 11 727 (51.3%) subjects with low-risk, 9777 (42.7%) subjects with moderate-risk, and 1374 (6.0%) with high-risk subjects. Baseline clinical and laboratory characteristic of study subjects by the three SCORE groups are presented in Table 1.
Baseline characteristics of study population according to SCORE risk*
| Low (n = 11 727) | Moderate (n = 9777) | High (n = 1374) | All (n = 22 878) | |
|---|---|---|---|---|
| Age (years) | 40.7 ± 7.1 | 53.8 ± 8.0 | 58.8 ± 10.1 | 47.4 ± 10.3 |
| Female | 45.4% | 10.6% | 9.9% | 28.4% |
| SCORE | 0 ± 0 | 1.5 ± 0.8 | 5.3 ± 0.9 | 1.0 ± 1.4 |
| Framingham score | 2.5 ± 3.0 | 11.3 ± 6.3 | 25.9 ± 7.1 | 7.7 ± 8.0 |
| Active smokers | 17.4% | 21.6% | 23.4% | 19.6% |
| BMI (kg/m2) | 25.0 ± 3.88 | 27.1 ± 3.57 | 28.6 ± 4.35 | 26.1 ± 3.96 |
| Overweight | 34.9% | 52.5% | 49.6% | 43.3% |
| Obese | 9.8% | 18.2% | 30.3% | 14.6% |
| Systolic BP (mmHg) | 115 ± 13 | 130 ± 16 | 142 ± 22 | 123 ± 17 |
| Diastolic BP (mmHg) | 74 ± 9 | 81 ± 10 | 83 ± 10 | 78 ± 10 |
| Treated hypertension | 4.4% | 24.3% | 52.0% | 15.8% |
| Treated dyslipidaemia | 2.0% | 5.7% | 15.3% | 4.4% |
| Total cholesterol (mg/dL) | 188 ± 34 | 201 ± 34 | 188 ± 36 | 194 ± 35 |
| HDL (mg/dL) | 50 ± 13 | 45 ± 10 | 43 ± 10 | 48 ± 12 |
| Low HDL | 35.1% | 41.6% | 52.2% | 38.9% |
| LDL (mg/dL) | 117 ± 28 | 129 ± 29 | 117 ± 30 | 122 ± 29 |
| Triglycerides (mg/dL) | 114 ± 64 | 145 ± 79 | 162 ± 103 | 130 ± 76 |
| Fasting glucose (mg/dL) | 86 ± 9 | 93 ± 14 | 136 ± 48 | 92 ± 20 |
| Impaired fasting glucose | 6.4% | 23.2% | 15.5% | 14.1% |
| Estimated GFR | 106 ± 23 | 94 ± 22 | 94 ± 29 | 100 ± 23 |
| Haemoglobin (mg/dL) | 14.1 ± 1.4 | 15.0 ± 1.3 | 14.9 ± 1.2 | 14.6 ± 1.4 |
| Uric acid (mg/dL) | 5.1 ± 1.4 | 5.8 ± 1.2 | 5.7 ± 1.3 | 5.4 ± 1.4 |
Low risk: SCORE <1; moderate risk: 1 ≤ SCORE < 5; high risk: SCORE ≥5.
BMI, body mass index; BP, blood pressure; HDL, high-density lipoprotein; LDL, low-density lipoprotein; IFG, impaired fasting glucose; GFR, glomerular filtration rate (Cockcroft–Gault equation).
*P-value of <0.001 for all comparisons.
Results of the EST are summarized in Table 2. Low-risk subjects demonstrated significantly superior results in all aspects of the treadmill exercise. Compared with moderate- and high-risk subjects, low-risk subjects achieved longer exercise duration time, with corresponding higher estimated METs and higher estimated VO2 max. In addition, the percentage of subjects with poor fitness (METs <11) was significantly smaller among low-risk subjects in comparison with moderate- and high-risk subjects (34.8, 47.1, and 68.7%, respectively).
Results of treadmill exercise stress testing*
| Low (n = 11 727) | Moderate (n = 9777) | High (n = 1374) | All (n = 22 878) | |
|---|---|---|---|---|
| Resting HR | 77 ± 13 | 77 ± 13 | 80 ± 13 | 77 ± 13 |
| Resting SBP | 114 ± 13 | 125 ± 16 | 134 ± 19 | 120 ± 16 |
| Resting DBP | 74 ± 8.2 | 79 ± 8.8 | 81 ± 9.4 | 76 ± 9.0 |
| Peak exercise HR | 172 ± 11 | 159 ± 14 | 150 ± 18 | 165 ± 15 |
| % of expected | 95.8 ± 5.1 | 95.4 ± 6.3 | 92.9 ± 8.7 | 95.5 ± 5.9 |
| Heart rate reserve | 95.2 ± 15.8 | 81.6 ± 17.0 | 69.5 ± 19.1 | 87.9 ± 18.4 |
| Peak exercise SBP | 162 ± 20.5 | 177 ± 23.1 | 184 ± 24.3 | 170 ± 23.4 |
| Peak exercise DBP | 74.9 ± 8.2 | 80.7 ± 9.4 | 82.0 ± 10.1 | 77.8 ± 9.4 |
| Exercise duration (in seconds) | 634 ± 179 | 583 ± 181 | 501 ± 178 | 604 ± 183 |
| Estimated METs | 12.1 ± 2.9 | 11.2 ± 2.9 | 9.8 ± 2.9 | 11.6 ± 2.9 |
| Low fitness (METs <11) | 34.8% | 47.1% | 68.7% | 42.1% |
| Estimated VO2 max | 40 ± 10 | 35 ± 10 | 30 ± 9 | 37 ± 10 |
| Recovery HR | 94 ± 11 | 93 ± 12 | 92 ± 13 | 93 ± 12 |
| Recovery SBP | 120 ± 13 | 131 ± 15 | 138 ± 18 | 125 ± 16 |
| Recovery DBP | 72 ± 8 | 77 ± 8 | 79 ± 8 | 75 ± 8 |
*P-value of <0.001 for all comparisons.
Association of SCORE and fitness with overall survival
There were 505 (2.21%) deaths during a mean follow-up of 9.2 ± 4.1 years. Fifty-one deaths occurred in the lower-risk group (0.4% of the group population), 331 (3.4%) in the intermediate-risk group, and 123 (9.0%) in the high-risk group. Kaplan–Meier survival analysis showed that subjects in the higher SCORE groups had increased mortality: the respective cumulative probabilities of deathin the low, intermediate, and high SCORE groups at 9 years of follow-up were 0.4, 2.6, and 6.8%, respectively (Figure 1A; P < 0.001 for the overall difference during follow-up). When the SCORE risk was used as a continuous variable in a Cox regression univariable model, a one point increase in SCORE risk was associated with a significantly elevated risk of death (HR = 1.49; 95% CI 1.45–1.54; P < 0.001). The increase in mortality was also significant in a multivariable model (Table 3), and each one increment in the SCORE risk was associated with a corresponding 27% increased risk for all-cause mortality (HR = 1.27; 95% CI 1.22–1.33; P < 0.001). The same associations were found when fitness was considered as a continuous variable. In both mutivariable models, reduced renal function and older age were additional independent significant predictors of mortality. Consistent with these findings, Kaplan–Meier survival analysis showed that when fitness was evaluated alone, the cumulative probability of death at 9 years was 0.8 and 2.8% according to whether the METs level was, respectively, higher or lower than the median 11 (Figure 1B).
Multivariable Cox regression model for non-cancer-related death
| Fitness as dichotomous variable (METs <11) | Fitness as continuous variable (1-MET increment) | |||||
|---|---|---|---|---|---|---|
| HR | 95% CI | P | HR | 95% CI | P | |
| SCORE (continuous)a | 1.27 | 1.22–1.33 | <0.0001 | 1.27 | 1.22–1.33 | <0.0001 |
| Fitness | 1.76 | 1.43–2.17 | <0.0001 | 0.90 | 0.88–0.93 | <0.0001 |
| Overweight (BMI >25 kg/m2) | 1.09 | 0.89–1.33 | NS | 1.08 | 0.88–1.32 | NS |
| IFG | 1.14 | 0.94–1.39 | NS | 1.13 | 0.93–1.37 | NS |
| Reduced renal function | 3.37 | 2.62–4.34 | <0.0001 | 3.13 | 2.43–4.03 | <0.0001 |
| Older age (age >50) | 2.87 | 2.22–3.70 | <0.0001 | 2.83 | 2.19–3.65 | <0.0001 |
Obesity = BMI > 25 kg/m2; reduced renal function was defined as estimated GFR <60 (Cockcroft–Gault equation).
BMI, body mass index; IFG, impaired fasting glucose; NS, non-significant.
aSCORE is based on gender, age, systolic blood pressure, smoking status, total cholesterol, and HDL concentrations.
Combined assessment of SCORE and fitness
To further show that fitness and SCORE are independent predictors of mortality, we divided our cohort into six different categories by combining SCORE and fitness, and found significantly different HRs for each category (Table 4). Kaplan–Meier survival analysis (Figure 2) found a significant association between low fitness and increased cumulative probability of death at 9 years in each of the SCORE groups (P < 0.001). Consistent with the Kaplan–Meier findings, multivariable analysis showed that subjects with a low SCORE, but low fitness, experienced a 2.1-fold increased risk for all-cause mortality compared with low SCORE subjects who had high fitness (P = 0.016). Similarly, within the moderate SCORE group, those who had low fitness experienced a 2.0-fold (P < 0.001) increased risk for all-cause mortality, and within the high SCORE group, those who had low fitness experienced a 3.4-fold (P < 0.001) increased risk for all-cause mortality.
Cox regression model for non-cancer-related death, according to combined SCORE and fitness category
| HR | 95% CI | P | |
|---|---|---|---|
| SCORE low (<1), fitness high (≥11) | reference | ||
| SCORE low (<1), fitness low (<11) | 2.34 | 1.34–4.09 | 0.003 |
| SCORE moderate (1 ≤ SCORE < 5), fitness high (≥11) | 5.86 | 3.67–9.368 | <0.0001 |
| SCORE moderate (1 ≤ SCORE < 5), fitness low (<11) | 13.41 | 8.58–20.98 | <0.0001 |
| SCORE high (≥5), fitness high (≥11) | 8.45 | 4.16–17.18 | <0.0001 |
| SCORE high (≥5), fitness low (<11) | 35.57 | 22.27–56.62 | <0.0001 |
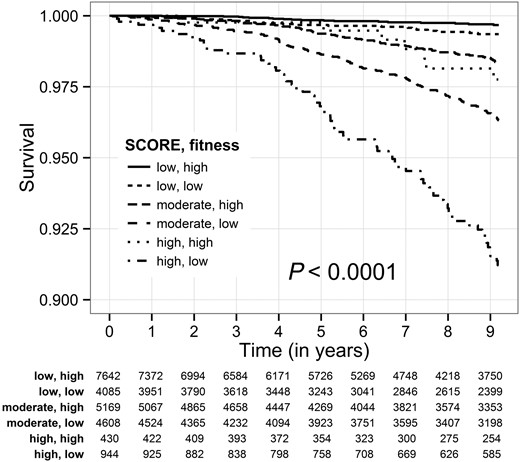
Kaplan–Meier survival by combined SCORE group and estimated metabolic equivalents. Fitness: low—metabolic equivalents <11; high—metabolic equivalents ≥11.
Improving risk prediction by adding physical fitness to the SCORE
In order to approximately quantify the improvement in risk prediction allowed by incorporating a measure of exercise capacity to the SCORE, using the NRI approach, we defined a modified SCORE. The original SCORE is calculated by a complex model that includes age, gender, smoking status, systolic blood pressure, total cholesterol, and HDL. We did not want to alter this model, so we defined our fitness adjusted score by adding an independent term for fitness, so that the modified SCORE is increased in low fitness patients, and decreased otherwise. The threshold of 11 METs was previously used to distinguish patients with lower than usual exercise capacity, so we simply subtracted the term (METs-11)/50 from the original SCORE risk (the division of the estimated METs by 50 is performed to ensure that the fitness term does not change the SCORE by more than one point). We assessed the improvement in risk prediction using the NRI approach, applied to survival data. At the mean follow-up time of 9 years, continuous NRI indicated an improvement in risk prediction of ∼57%, and categorical NRI showed a similar improvement. Integrated Discrimination Improvement (IDI) was significantly above zero (IDI = 8.72 × 10⁻⁴). Details of the NRI and IDI analyses are provided in the Supplementary material online. We computed the Receiver Operator Characteristics (ROC) of the models and found that the addition of the physical fitness term improved the AUC by 0.016 (0.782 vs. 0.766).
Discussion
The main finding of the present study is that among low-risk subjects, exercise capacity can be used to identify subjects with increased risk of all-cause mortality. In our population, which includes asymptomatic adults free of known ischaemic heart disease, the results of EST can be used to improve the SCORE risk stratification with respect to overall survival. In order to roughly quantify the improvement in risk prediction, we incorporated an independent term measuring exercise capacity to the SCORE, and found that this new term allows an improvement in risk prediction of ∼57%, as measured by NRI.
Fitness, cardiovascular risk, and overall survival
The association between cardio-respiratory fitness, cardiovascular risk, and all-cause mortality is well established and based on strong evidence.18,19 In the largest meta-analysis to date, with 102 980 participants in 33 eligible studies, Kodama et al. convincingly demonstrated that higher cardio-respiratory fitness is associated with lower risk of all-cause mortality and CVD, with 13% risk reduction for each 1-MET increase in cardio-respiratory fitness.6 Similarly, the Cooper Center Longitudinal Study followed 11 049 men and demonstrated that low fitness was associated with increased lifetime risk of CVD death at all age groups.20 Current guidelines therefore recommend exercise training as an important non-pharmacological tool for primary and secondary cardiovascular prevention.3 The results of our current analysis are in line with these observations, and help to strengthen and extend the evidence with respect to low-risk individuals of high socio-economic background. Our population was exceptionally healthy, with an average SCORE of 0.96 ± 1.44, average Framingham score of 7.6 ± 8.0, and with 94% of the population in the low and intermediate cardiovascular risk groups. Even in this healthy and relatively young population, and after excluding subjects with metastatic cancer disease, we were able to show a strong independent association between low fitness and poor survival.
Risk assessment of low- and moderate-risk individuals
Despite the strong association between low fitness and CVD risk, current practice guidelines state that the contribution of cardio-respiratory fitness to risk assessment for a first atherosclerotic cardiovascular event is uncertain at present.21 This cautious approach is in part justified by the fact that only 7 out of the 33 studies that were included in the meta-analysis of Kodama adjusted for known cardiovascular risk factor, and even in these studies, the adjustment was partial and limited to specific subpopulations and risk factors.22,23 Our NRI analysis suggests that even after adjustment for all the variables that are included in the SCORE model, the addition of the objectively measured cardio-respiratory fitness could improve risk stratification by ∼50% in low-risk populations. This is consistent with the guidelines statement that the SCORE model can underestimate cardiovascular risk among specific populations.3 Our work is supported by a recent study of Dhoble et al.24 who examined 6546 patients in the USA who were referred to EST, as well as by the study of Mora et al. of 6136 asymptomatic adults. While SCORE risk prediction model was not evaluated in those studies, both analyses convincingly showed that EST provided incremental information in addition to conventional cardiovascular risk factors.25
While our results need to be validated in other populations and appropriately controlled cohorts, they support the hypothesis that the risk factors currently in use can underestimate cardiovascular risk, especially among young and relatively healthy adults. Whereas the data are inconclusive as to whether fitness is an independent predictor or merely a marker of increased risk (e.g. physical inactivity or unhealthy diet), our results show that fitness holds the potential to help the clinician to reclassify subjects who were otherwise considered at low cardiovascular risk.
Limitation of the analysis
This study uses total mortality as the only outcome, since cause-specific mortality was not available. The SCORE tool was meant to predict cardiovascular mortality, not total mortality, and therefore our results may not be generalized to risk stratification of cardiovascular death. However, mortality statistics in Israel during the period of the study were very similar to statistics of the European Union, with cardiovascular death being the second most common cause of death after cancer.26 We have attempted to eliminate patients for which the cause of death is unlikely to be cardiovascular by excluding subjects diagnosed with metastatic cancer from our cohort.
Our study has several other limitations. This is a non-randomized observational study that included relatively healthy middle-aged Caucasian subjects of high socio-economic background and very low cardiovascular co-morbidities. Exercise stress testing is time consuming, and its evaluation for all patients might not be practical in clinical practice. Finally, if fitness is to be added in a general risk stratification model, it would probably be more appropriate to account for its possible interactions with the other risk factors by incorporating it earlier in the model, rather than adding it as an independent term, as we did in this study.
Conclusion
In summary, both SCORE and exercise capacity are strong predictors of all-cause mortality among asymptomatic relatively young and healthy adults. The addition of exercise capacity to the SCORE risk model can significantly improve the accuracy of the model in this population. There is a need for larger scale observational or controlled studies to evaluate the consistency of our findings.
Supplementary material
Supplementary material is available at European Heart Journal online.
Authors' contributions
A.I. and E.M. performed statistical analysis. B.L., Y.S., and S.K. handled funding and supervision. S.S. and S.K. acquired the data. A.I., E.M., B.L., Y.S., S.K., and A.B. conceived and designed the research. A.I., E.M., and I.G. drafted the manuscript. A.I., E.M., S.S., I.G., Y.S., R.K., and A.B. made critical revision of the manuscript for key intellectual content.
Funding
This work was supported in part by a grant from the Shalvi foundation for medical research, and by the contribution of Nathan Hetz for medical research.
Conflict of interest: none declared.
References

